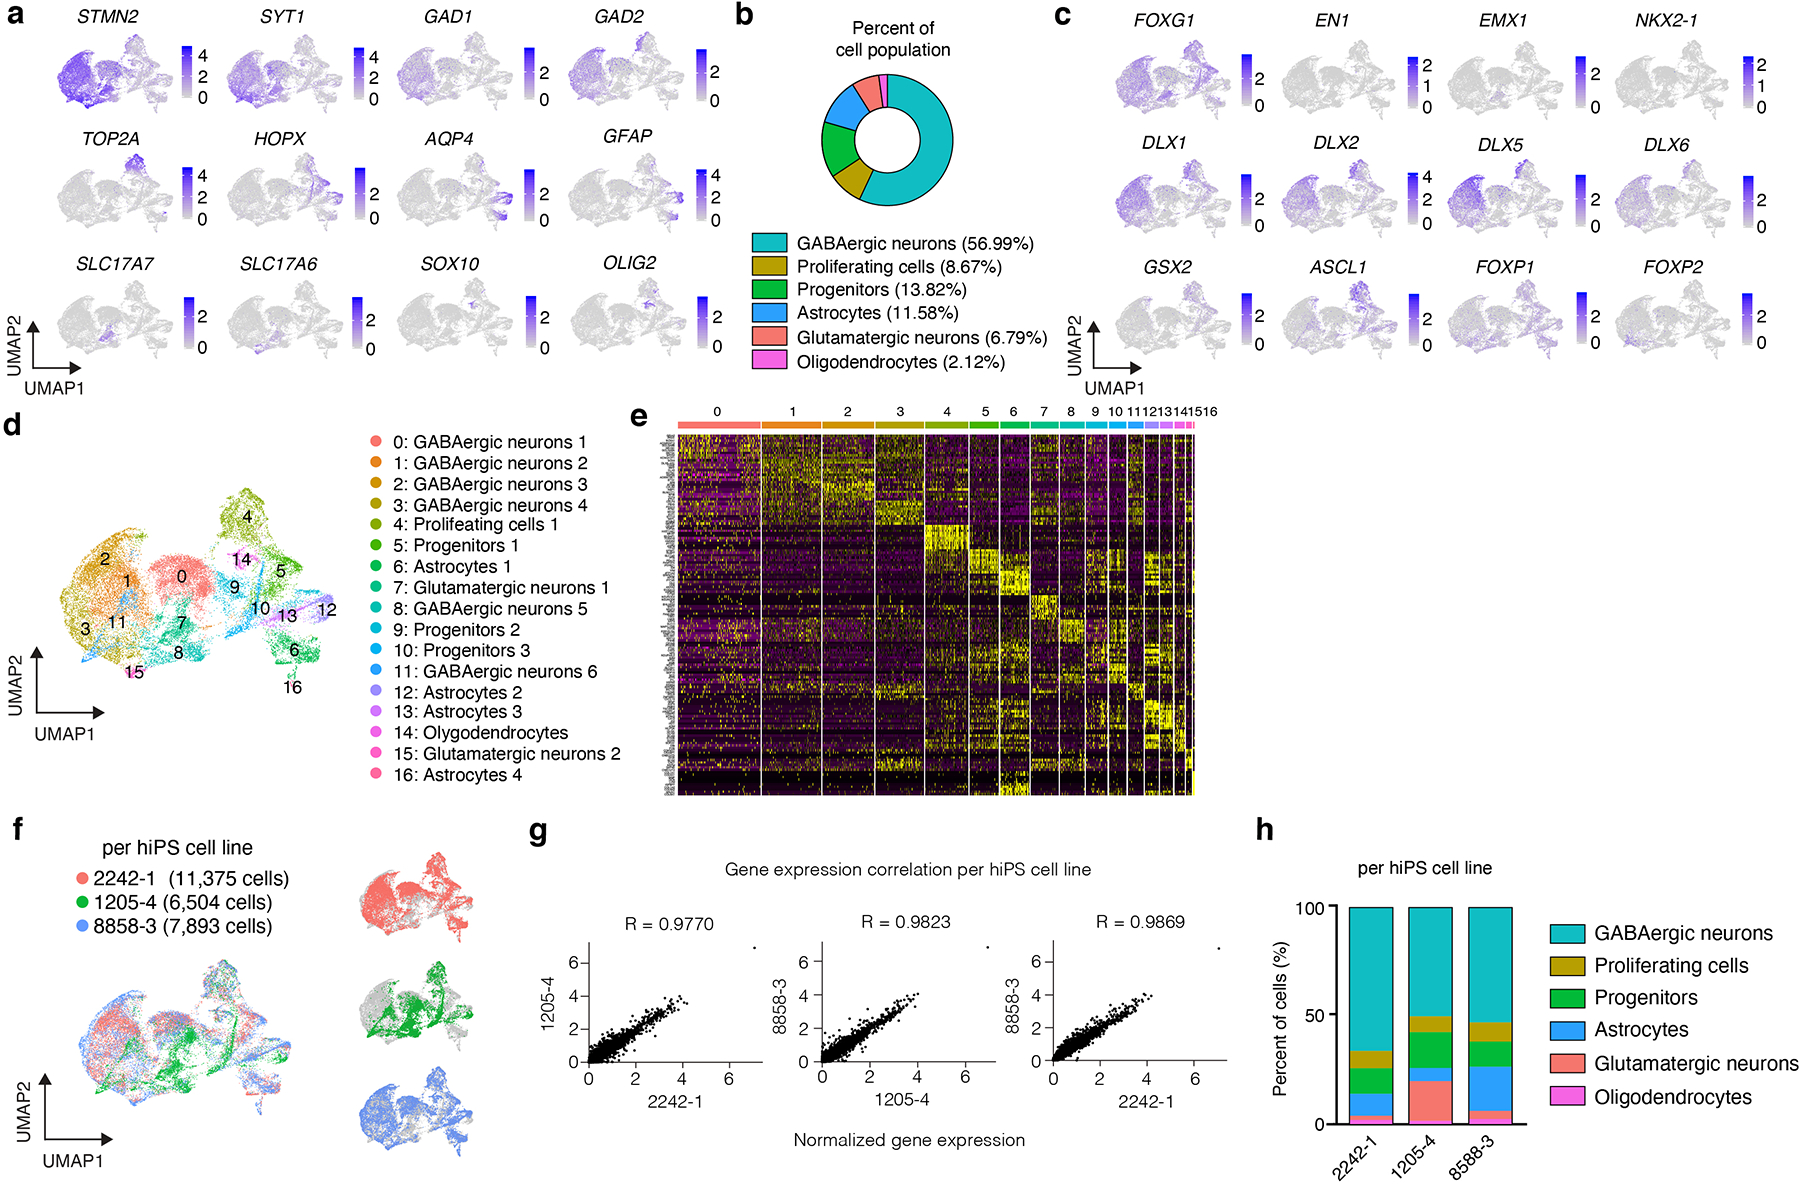
Extended Data Fig. 3. Characterization of hStrS.

(a) UMAP visualization of expression of selected genes in the hStrS single cell RNA-seq data at day 80–83 of in vitro differentiation (n = 25,772 cells from 3 hiPS cell lines). (b) Percentage of major cell type clusters in hStrS. (c) Expression of forebrain (FOXG1), midbrain, hindbrain (EN1), dorsal forebrain (EMX1), LGE and MGE markers in hStrS. (d) UMAP visualization of the resolved single cell RNA-seq data of hStrS, and (d) heat map for the top 10 genes in each cluster. (f) UMAP visualization of the single cell RNA-seq data color coded by the hiPS cell lines: 2242–1 (red), 1205–4 (green), 8858–3 (blue). (g) Plots showing the Pearson correlation of the normalized average gene expression between each of the three hiPS cell lines used. (h) Graph showing the percentage of cells in each of the three hiPS cell lines belonging to each cluster in hStrS.
