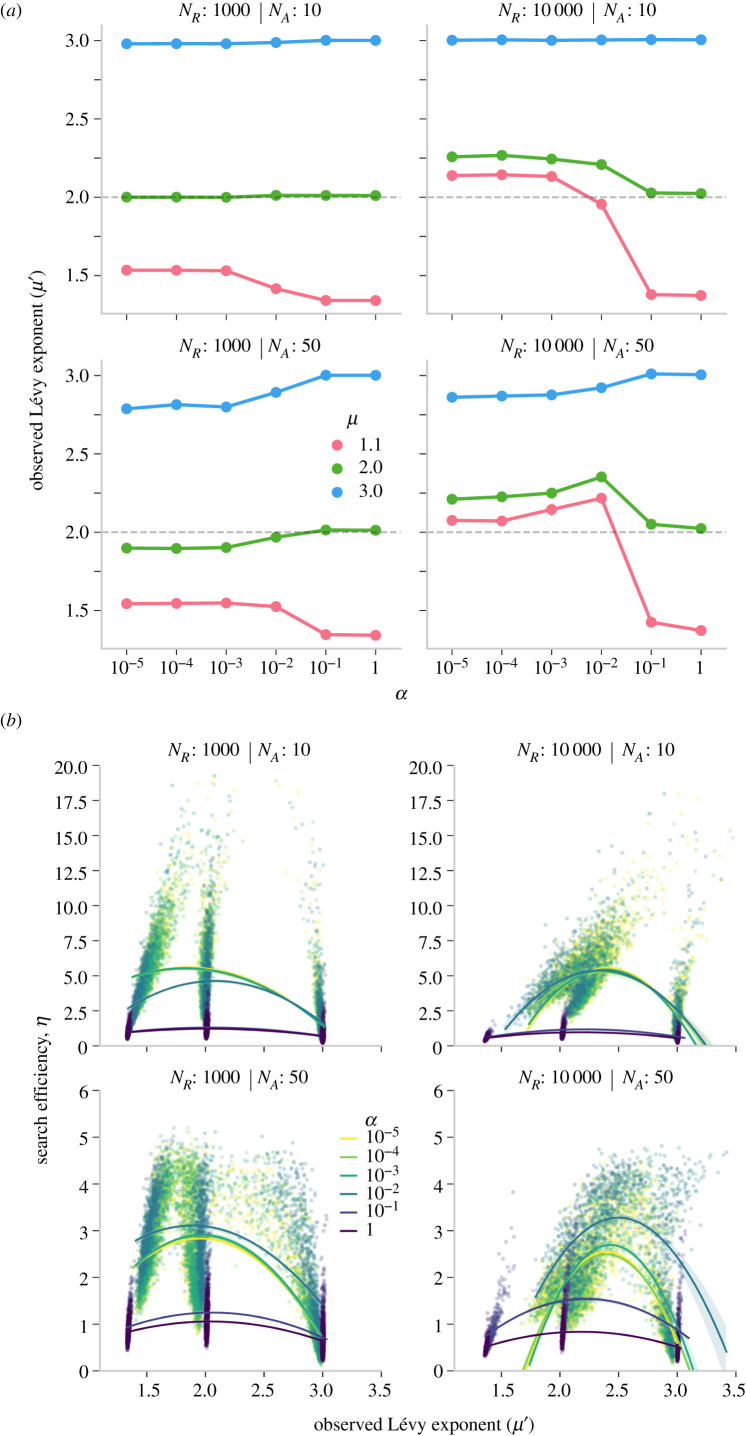
Figure 4.
(a) Mean estimates of observed Lévy exponents (μ′) for different Lévy walks (μ), resource density (NR) and group size (NA) in clustered environments (β = 3). Dashed line shows the theoretical optimum of μ = 2. (b) Correlation between search efficiency and the observed Lévy exponent for all simulations. Top: 10 agents and bottom: 50 agents.

