Figure 4.

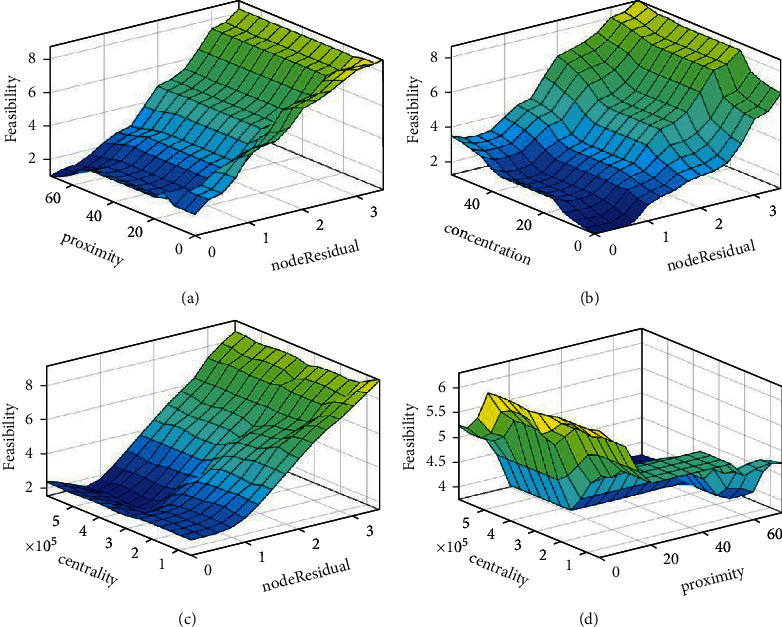
Surface plots representing rule base. (a) Proximity vs. node residual energy. (b) Concentration vs. node residual energy. (c) Centrality vs. node residual energy. (d) Centrality vs. proximity to the base n.

Surface plots representing rule base. (a) Proximity vs. node residual energy. (b) Concentration vs. node residual energy. (c) Centrality vs. node residual energy. (d) Centrality vs. proximity to the base n.