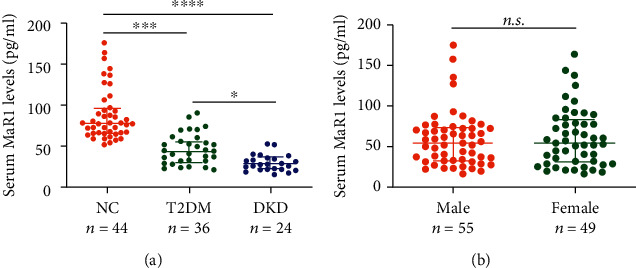
Figure 1.

MaR1 levels in different groups. (a) Circulating MaR1 levels in normal, T2DM and DKD groups. (b) Circulating MaR1 levels in subgroups stratified by gender. Each data point represents a serum sample, the horizontal middle line in each data set represents the median, and the limits of the vertical lines represent the interquartile range. One-way ANOVA with Tukey's post hoc test was performed for multiple comparisons. ∗∗∗∗P < 0.0001; ∗∗∗P < 0.001; ∗P < 0.05; n.s.: not significant.
