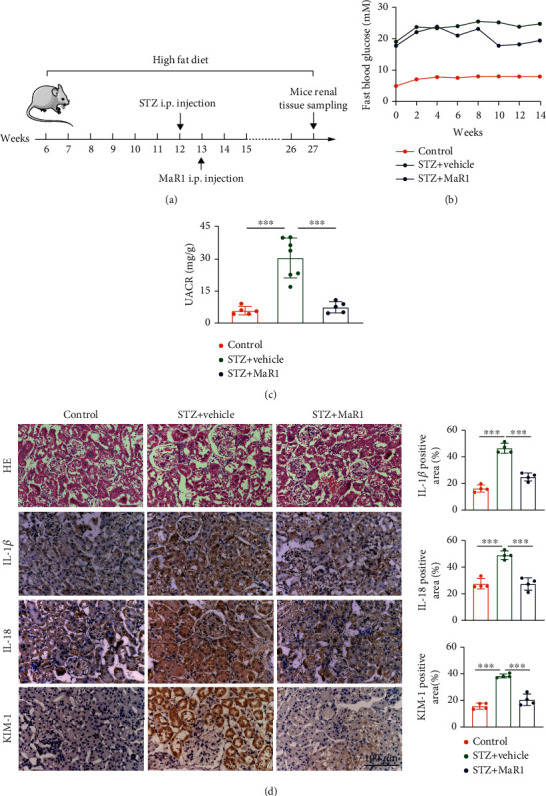
Figure 3.

MaR1 ameliorated hyperglycemia and renal dysfunction in DKD mouse model. (a) Experimental design for MaR1 treatment DKD mice induced by HFD combined with STZ. (b) Mean blood glucose level of mice in indicated group (n =5 in control group, n =7 in DKD group and n =5 in DKD+ MaR1 group). (c) Urinary albumin to creatinine ratio (UACR) of mice in indicated group (n =5 in control group, n =7 in DKD group and n =5 in DKD + MaR1 group). (d) The representative photomicrographs of HE and immunohistochemistry (IL-1β, IL-18 and KIM-1) showing the pathological changes in kidneys from indicated groups. Bar: 100 μm. Data were expressed as mean ± SD; ∗∗∗P <0.001.
