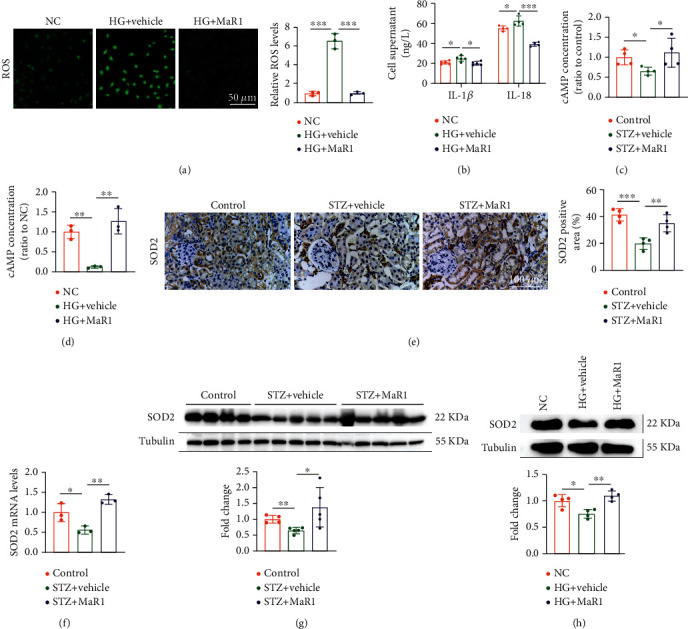
Figure 5.

MaR1 reversed high glucose-induced ROS overproduction through cAMP-SOD2 antioxidant pathway. (a) DCFH-DA probe was used to detect the levels of ROS in high glucose-stimulated HK-2 cells with MaR1 intervention. Bar: 50 μm. (b) ELISA assay showing the levels of IL-1β and IL-18 in cell culture supernatant of high glucose-stimulated HK-2 cells with MaR1 intervention. (c) The concentrations of cAMP in DKD mouse kidney with MaR1 intervention. (d) The concentrations of cAMP in high glucose-stimulated HK-2 cells with MaR1 intervention. (e) Representative immunohistochemistry images showing the protein levels of SOD2 in DKD mouse kidney with MaR1 intervention. (f) qRT-PCR showing the mRNA levels of SOD2 in DKD mouse kidney with MaR1 intervention. (g) Representative western blotting analysis images showing the protein levels of SOD2 in DKD mouse kidney with MaR1 intervention. (h) Representative western blotting analysis images showing the protein levels of SOD2 in high glucose-stimulated HK-2 cells with MaR1 intervention. All results are representative of three independent experiments. Data were expressed as mean ± SD; ∗P <0.05; ∗∗P <0.01; ∗∗∗P <0.001.
