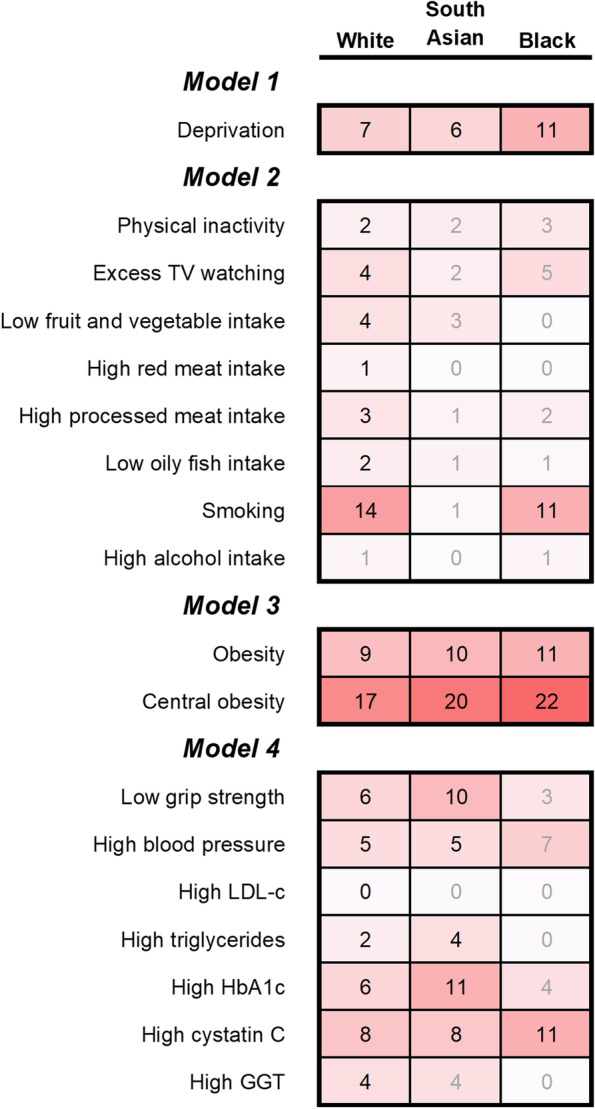
Fig. 1.

Population attributable fractions for risk factors by ethnic group. Numbers in cells are population attributable fractions for that ethnic group. PAFs with 95% CIs overlapping 0 are greyed out. Model 1: adjusted for age and sex only. Model 2: additionally adjusted for deprivation. Model 3: additionally adjusted for lifestyle factors. Model 4: additionally adjusted for adiposity markers. TV, television; BMI, body mass index; HbA1c, glycated haemoglobin; GGT, gamma-glutamyl transferase. Continuous variables were categorised as quintiles in this analysis. Obesity defined as BMI≥30.0 kg/m2, central obesity as WHR >0.85 for women and >0.90 for men, low grip strength as 1st quintile, and high blood pressure, LDL-c, triglycerides, HbA1c, cystatin C, and GGT as the 5th quintile
