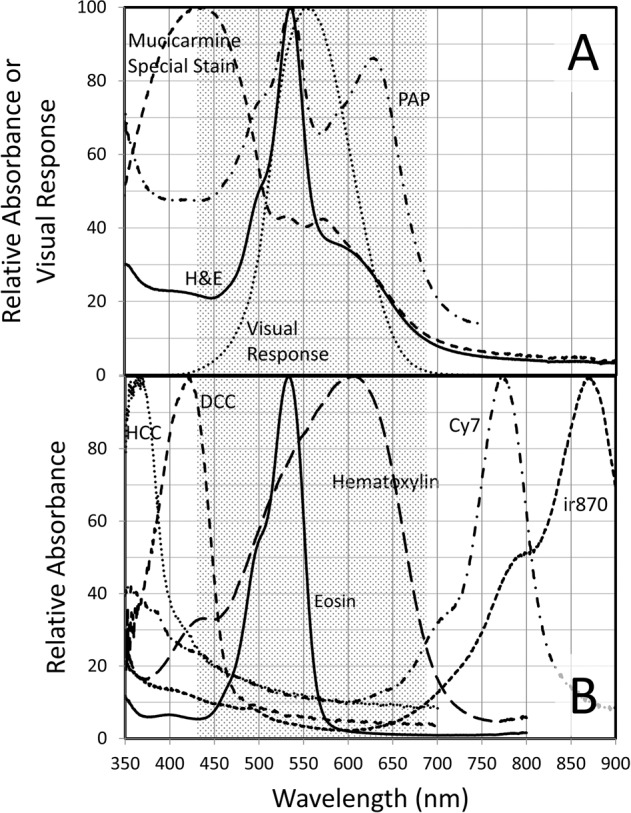
Fig. 1. Absorbance spectra of several conventional histological and cytological stains and several invisible chromogens compared to the human photopic (light-adapted) visual response (relative luminosity factors12).

A H&E (tonsil FFPE tissue), PAP (cervical cell ThinPrep), and mucicarmine special stain (NSCLC FFPE tissue) absorbance spectra, and relative luminosity factors, all scaled to 100 at their respective maxima. B HCC, DCC, Cy7, and ir870 CDC absorbance spectra (deposited by Ki67 IHC on tonsil FFPE tissue), and hematoxylin and eosin absorbance spectra (separately applied to tonsil FFPE tissue), all scaled to 100 at their respective maxima. The shaded area approximates the visible spectral region, or more specifically, where relative luminosity factors are >1% of maximum.
