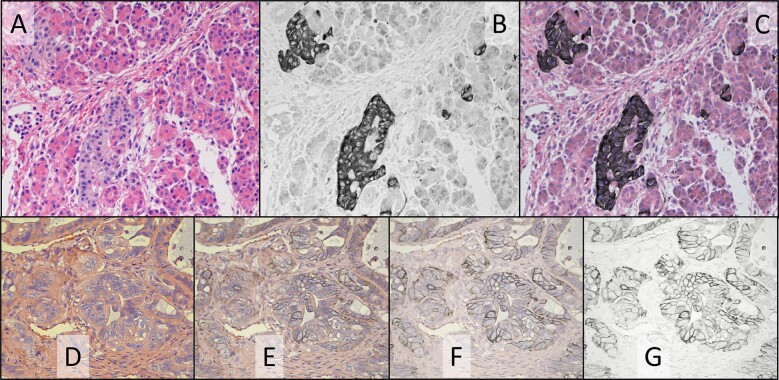
Fig. 3. Simultaneous H&E and IHC staining of normal pancreas FFPE tissue for synaptophysin (A–C) and breast tumor xenograft FFPE tissue for HER2 (D–G).
A Color camera image of transmitted visible light showing H&E staining of pancreas FFPE tissue. B Monochrome camera image of transmitted light at 769 nm (filtered tungsten light) where Cy7 CDC absorbs light, staining synaptophysin. C Color composite image created as product of color (A) and monochrome (B) images to show H&E and chromogen (synaptophysin) staining of pancreas tissue simultaneously. Overlays of color (D) and monochrome (G) images of decreasing color image opacity to show H&E and chromogen (HER2) staining of breast tumor xenograft simultaneously, with selectable relative contribution of color and monochrome images. Images were recorded using a ×20 objective.

