
FIGURE 3.
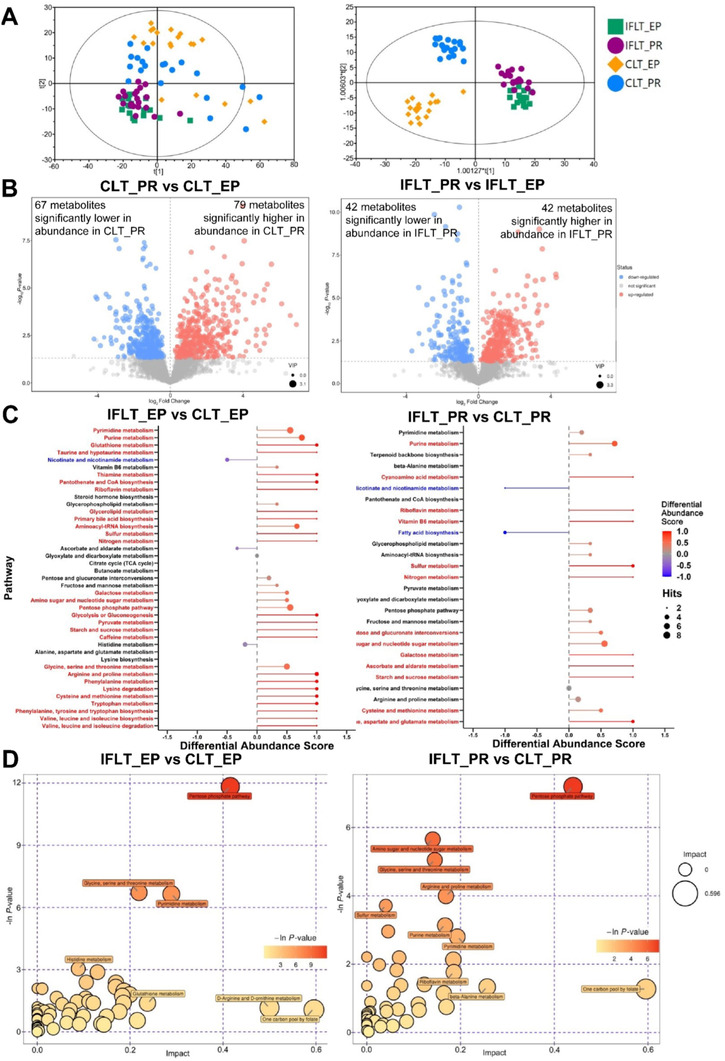
IFLT maintained active pentose phosphate pathway (PPP) metabolism and redox homeostasis. (A) PCA (left) and OPLS‐DA (right) score plots of LC‐MS/MS metabolomics data in the four subgroups. (B) Volcano plot showing CLT_PR vs CLT_EP (left) and IFLT_PR vs IFLT_EP (right). Each point in the volcano plot represents a metabolite, and the larger the scatter, the greater the VIP value. The scatter color represents the final screening result, metabolites that were significantly upregulated are red, metabolites that were significantly downregulated are blue, and metabolites that were not significantly different are gray. (C) Pathway‐based analysis of metabolic changes between IFLT_EP and CLT_EP and between IFLT_PR and CLT_PR. The differential abundance score shows the average gross changes of all metabolites in a pathway. A score of 1 indicates that all measured metabolites in the pathway increased, and −1 indicates that all measured metabolites in a pathway decreased. #, downregulated pathways; *, upregulated metabolism. (D) Pathway analysis of IFLT_EP vs CLT_EP and IFLT_PR vs CLT_PR. A larger bubble indicates a larger influence of the pathway, as shown by topological analysis. A darker color indicates more significant enrichment in the pathway
Abbreviations: CLT, conventional liver transplantation; EP, end‐preservation; IFLT, ischemia‐free liver transplantation; PR, postrevascularization