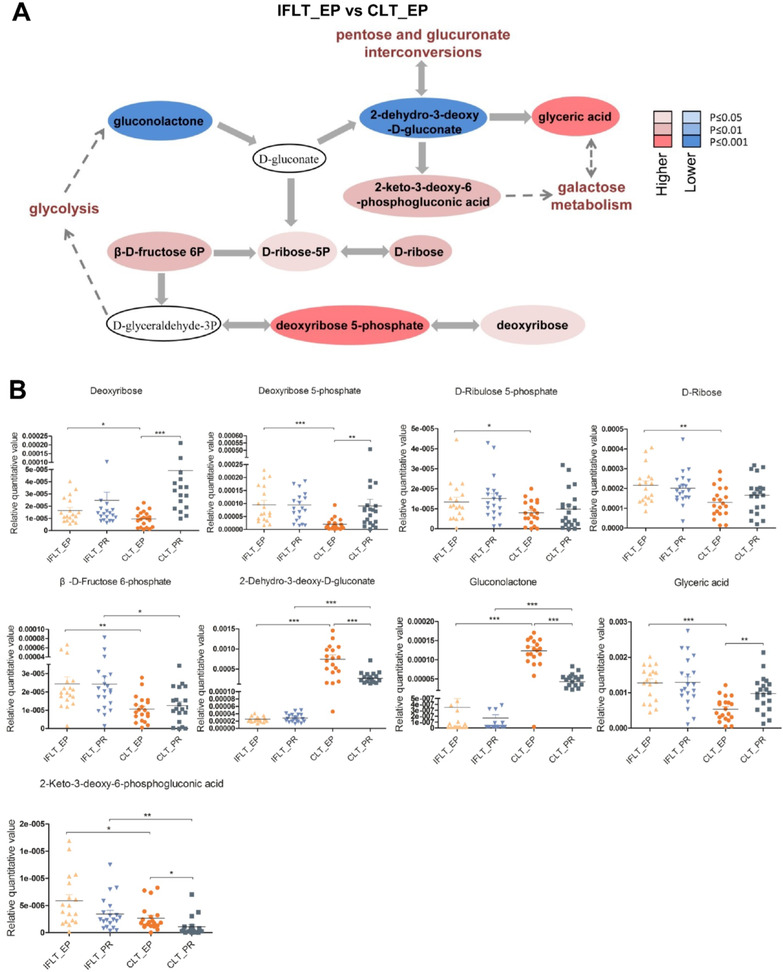
FIGURE 4.

Changes in pentose phosphate pathway (PPP) metabolites in the IFLT and CLT groups. (A) Metabolic changes in the PPP. Metabolites are labeled as color‐coded ovals. The color corresponds to the p value between IFLT_EP and CLT_EP. Red, increased; blue, decreased. (B) Nine of the deferentially expressed metabolites (DEMs) obtained by comparing IFLT_EP and CLT_EP belong to the PPP. In the four groups, the nine different metabolites were quantitatively compared, and scatter plots were made. *p < 0.05, **p < 0.01, ***p < 0.001. Abbreviations: CLT, conventional liver transplantation; EP, end‐preservation; IFLT, ischemia‐free liver transplantation; PR, postrevascularization
