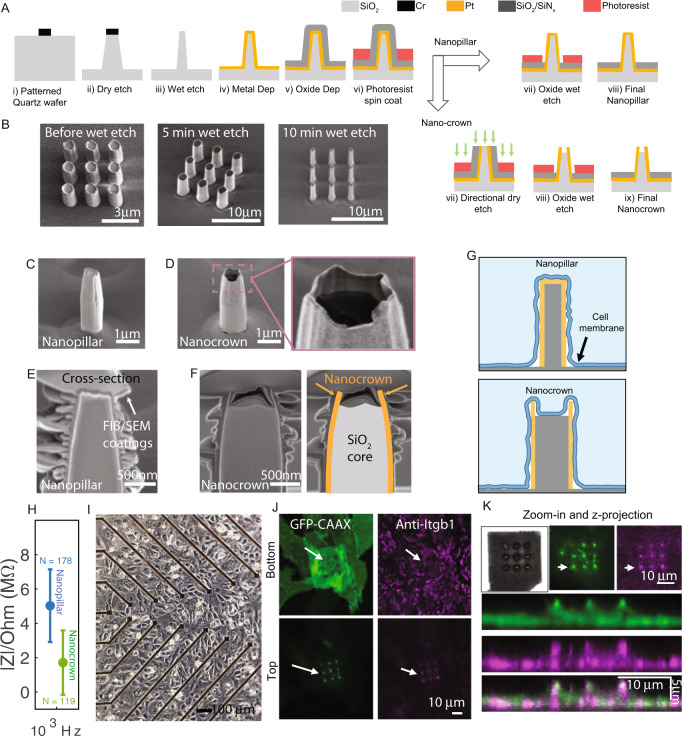
Fig. 1. Fabrication and characterization of robust nanopillar and nanocrown, nanoelectrodes arrays (NEAs).
A Illustrations of NEA nanofabrication steps. (i) Circular holes were patterned on transparent SiO2 wafers using maskless photolithography, followed by Cr evaporation. (ii) Reactive ion etching vertically into the SiO2 substrate to produce slightly-tapered vertical pillars of 700 nm diameters. (iii) pillars were thinned down to 200 nm diameter using a buffered oxide (BOE) wet etch. (iv) Pt metal was sputter coated onto the nanopillars to produce conductive vertical nanopillars. (v) An SiO2/Si3N4 layer was then evaporated onto the surface for insulation. (vi) Photoresist was coated around the nanopillar to protect the insulation layer for subsequent steps. To fabricate nanopillars, an oxide wet etch was used to remove the insulation layer from the pillar tops. To fabricate nanocorwn electrodes, first a directional dry etch was used to remove the SiO2/Si3N4 and Pt metal layers from the pillar tips. Next the SiO2 base of the nanopillar was etched down by a controlled oxide wet etch to fabricate nanocrowns with 50–200 nm depths. B SEM images of fabricated pillars before and after thinning with 5-min and 10-min BOE wet etch. C SEM image of a nanopillar electrode. D SEM image of a nanocrown electrode. E SEM image of a focused ion beam (FIB) milled cross section of nanopillar electrodes. F FIB/SEM image of nanocrown electrodes (Pt metal crown outlined in orange and SiO2 in gray). G Schematic illustration of the interface of nanopillar and nanocrowns with the cell membrane. H Impedance of nanopillar (blue) and nanocrown (green) NEAs at 1 kHz. Data are presented as mean values ± SD. I Brightfield microscope image of a monolayer of cardiomyocytes on a NEA device. J Confocal images of a cell on a nanocrown electrode, focused on either the top or bottom of the nanocrown. The cell membrane (CAAX:green) and Integrin adhesion proteins (Anti-Itgb1:purple) are seen on top of the nanocrowns (white arrows show location of nanocrowns). K Magnified image, and z projection of a cell on top of nanocrown electrodes showing the membrane (green) and integrins (purple) projection along the nanocrown height.

