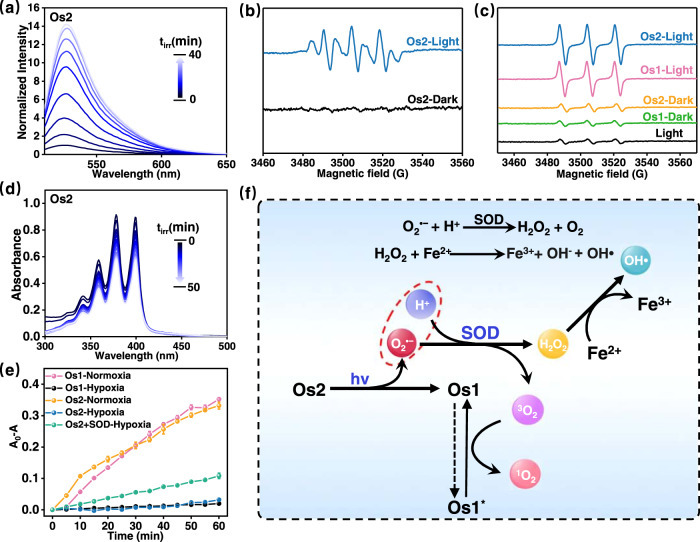
Fig. 2. Detection of ROS in solution.
a The emission spectra for monitoring O2•− generation by Os2 (10 μM) using DHR123 probe (10 μM, λex = 488 nm) in normoxia. b The ESR signal of O2•− trapped by DMPO (18 mM) after light irradiation in normoxia. c The ESR signal of 1O2 trapped by TEMP (8 mM) after light irradiation in normoxia. d The UV–Vis absorption spectra of ABDA (100 μM) for monitoring of 1O2 generated by Os2 (20 μM) under light irradiation in normoxia. e The plot of A0-A of ABDA at 378 nm versus irradiation time in the presence of Os1 or Os2 in hypoxia or normoxia (n = 3 independent experiments). Error bars represent S.D. from the mean. f Schematic diagram of generating O2•−, 1O2 and OH• by light-activating Os2. Light irradiation: 465 nm, 13 mW/cm2; Experiment temperature: 298 K; SOD superoxide dismutase.

