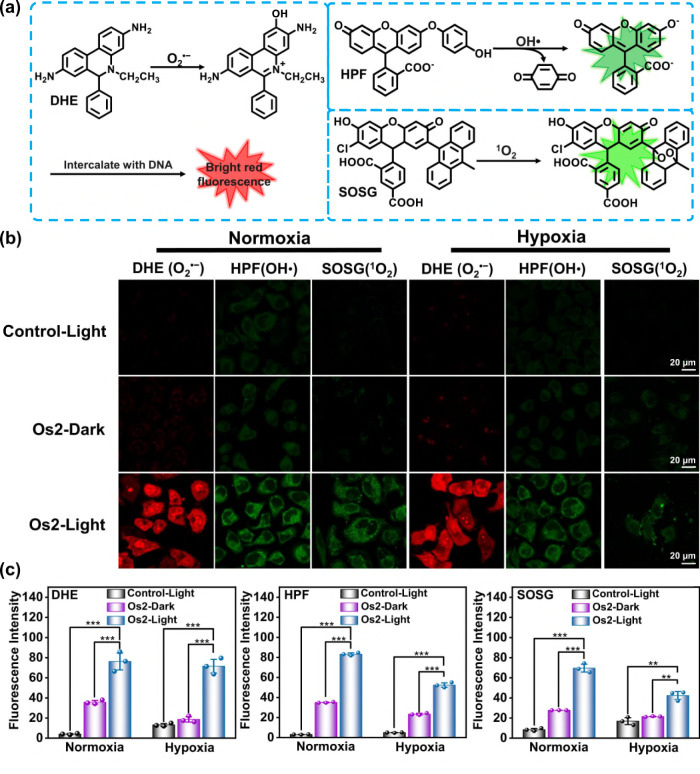
Fig. 3. Cellular ROS mesurement.
a Schematic diagram of detection of O2•−, OH• and 1O2 with DHE, HPF and SOSG probes, respectively. b Confocal microscope images of O2•−, OH• and 1O2 in HeLa cells under normoxia (20% O2) or hypoxia (1% O2) probed by DHE, HPF and SOSG, respectively. c The average fluorescence intensities calculated from the images in b. All experiments were repeated three times independently with similar results. Error bars represent S.D. from the mean. Statistical significance was calculated with two-tailed Student’s t test (*p < 0.05, **p ≤ 0.01 or ***p ≤ 0.001). HeLa cells incubated with Os2 (20 μM) for 8 h, and then treated with DHE (10 μM, 30 min), HPF (10 μM, 1 h) or SOSG (2.5 μM, 30 min). Incubation temperature: 310 K; Light irradiation: 465 nm, 13 mW/cm2, 1 h; DHE: λex = 488 nm, λem = 600 ± 30 nm; HPF: λex = 488 nm, λem = 530 ± 30 nm; SOSG: λex = 488 nm, λem = 525 ± 30 nm. DHE dihydroethidium; HPF hydroxyphenyl fluorescein; SOSG singlet oxygen sensor green.

