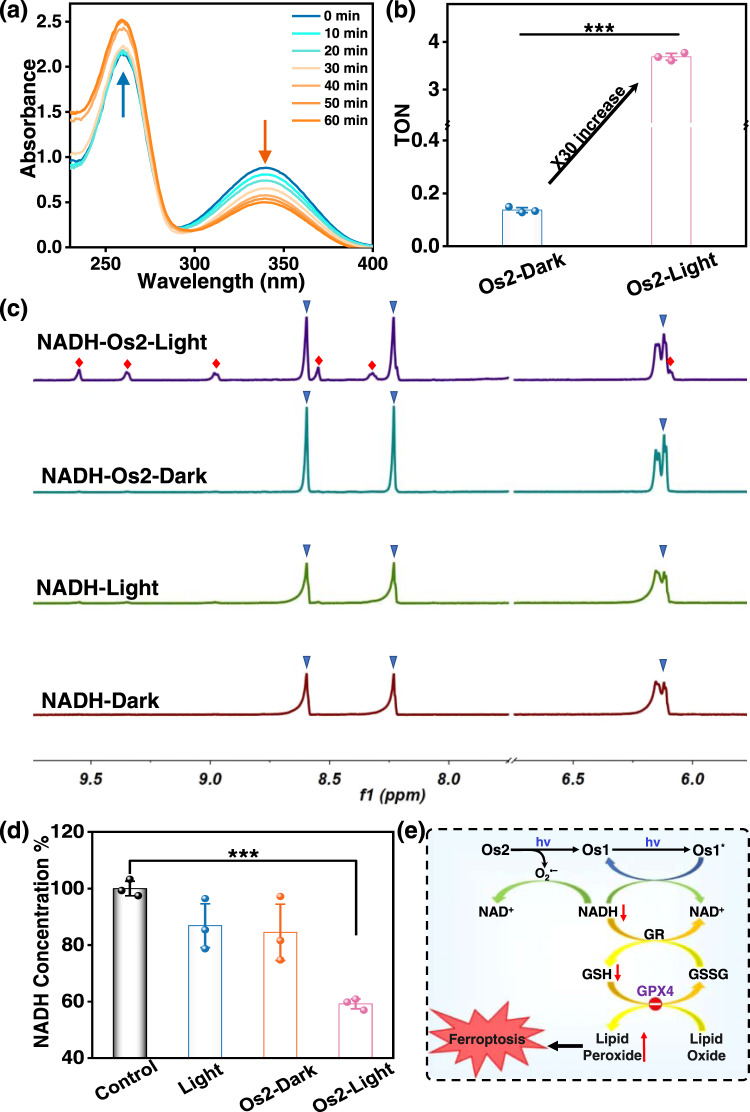
Fig. 6. Photocatalytic oxidation of NADH by Os2 under light irradiation.
a Reaction of Os2 (20 μM) and NADH (175 μM) in PBS solution under blue light irradiation monitored by UV–Vis absorption spectra at 298 K. b TON of Os2 under dark or irradiation conditions (n = 3 independent experiments, p = 0.0000016). c Photocatalytic oxidation of NADH (3.5 mM) by Os2 (0.25 mM) under dark or irradiation conditions monitored by 1H NMR spectroscopy at 298 K. Peaks associated with blue triangles represent NADH, those with red squares represent NAD+. d NADH concentrations in the treated HeLa cells. Os2: 20 μM, 310 K, 8 h. All the experiments were performed as duplicates of triplicates (n = 3 biologically independent samples, p = 0.000039). Error bars represent S.D. from the mean. Statistical significance was calculated with two-tailed Student’s t test (*p < 0.05, **p ≤ 0.01 or ***p ≤ 0.001). e Schematic diagram of the photocatalytic oxidation of NADH by Os2 and followed by induced ferroptosis. Light irradiation: 465 nm, 13 mW/cm2. TON turnover number, NADH 1,4-dihydro-nicotinamide adenine dinucleotide, GSH glutathione; GSSG oxidized glutathione, GPX4 glutathione peroxidase 4, GR glutathione reductase.

