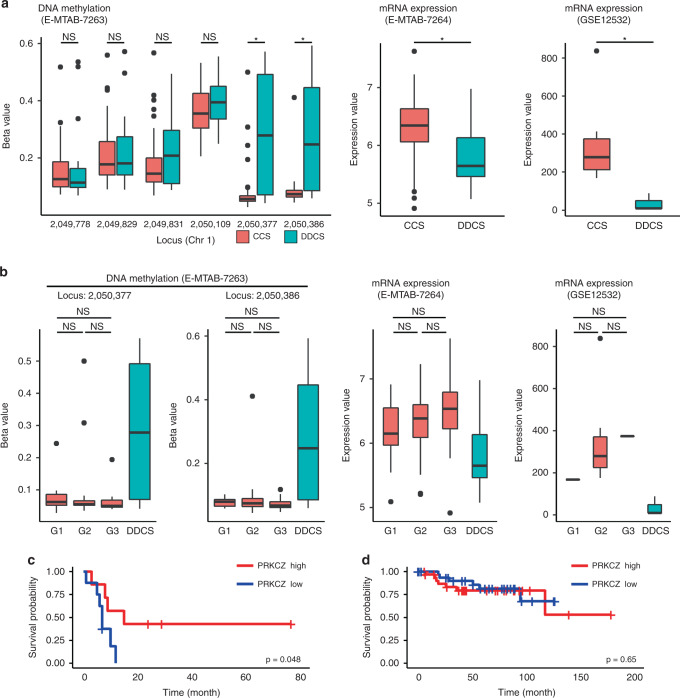
Fig. 2. Validation of DNA methylation and expression of PRKCZ.
a Comparison of DNA methylation level and expression level of PRKCZ between DDCS and CCS. Methylation levels of all probes near the transcription starting site of PRKCZ are shown (left). b Comparison of DNA methylation level and expression level of PRKCZ among the histological grades of CCS. In E-MTAB-7263 and 7264 datasets, n = 73 in CCS; 17 in Grade 1, 39 in Grade 2, and 17 in Grade 3; n = 16 in DDCS. In GSE12532 dataset, n = 12 in CCS; one in Grade 1, 10 in Grade 2, one in Grade 3; n = 3 in DDCS. c, d Comparison of survival rates in chondrosarcoma. c DDCS. d CCS. Log-rank test.

