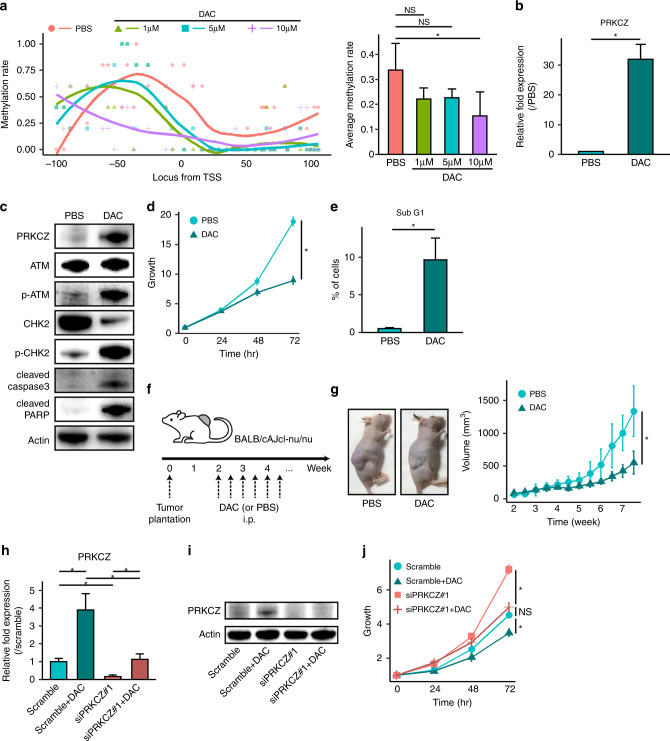
Fig. 6. Decitabine increases PRKCZ expression and induces apoptosis in NDCS-1.
a DNA methylation levels on the PRKCZ promoter in decitabine-treated vs. PBS-treated NDCS-1, as determined by bisulfite sequencing. Methylation rates of each C in CpG islands are indicated by dots (left). Curved lines indicate smooth local regression of methylation rates in each group (left). Average methylation rates (right). n = 5. In b–e 10 μM of decitabine-treated NDCS-1 vs. PBS-treated NDCS-1. b PRKCZ expression determined by RT-qPCR. c Expression of ATM/CHK2-related proteins and apoptosis-related proteins determined by western blotting. d Proliferation assay. e Sub-G1 fraction rate determined by cell cycle assay. f Schedule of tumour implantation and decitabine treatment in the xenograft assay. g Time course of tumour volume of xenografts in decitabine-treated NDCS-1 vs. PBS-treated NDCS-1. Images were obtained at the time of sacrifice; representative images are shown. n = 6. In h–j 10 μM of decitabine-treated NDCS-1 with or without siPRKCZ. h PRKCZ expression determined by RT-qPCR. i PRKCZ expression determined by western blotting. j Proliferation assay. In b, d, e, h, and j n = 3. In a, b, d, e, g, h, and j data are means ± SD. Two-tailed t-tests. *p < 0.05. NS not significant. DAC decitabine.

