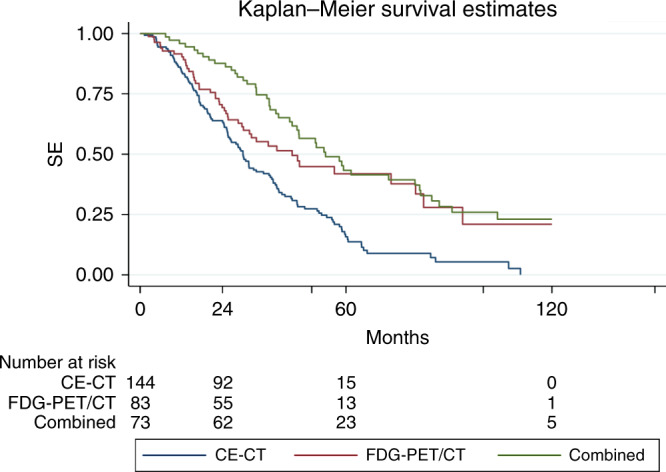
Fig. 2.

Kaplan–Meier plot and risk table showing survival of metastatic breast cancer patients according to response monitoring method (CE-CT contrast-enhanced computed tomography, FDG-PET/CT Fluorodeoxyglucose positron emission tomography with integrated computed tomography).
