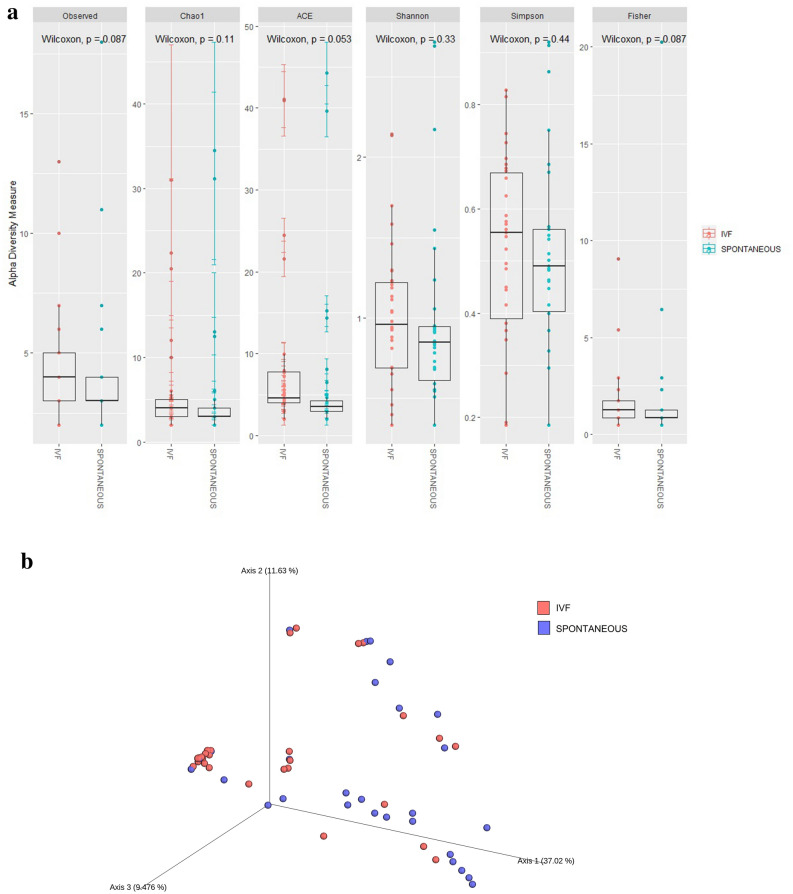
Figure 1.
Diversity analysis. (a) Alpha diversity indexes boxplots between both cohorts (IVF vs spontaneous). Different indexes are shown. Using two-sided Wilcoxon’s test followed by a P value adjustment using Bonferroni’s correction with 5% FDR. Boxes show median and interquartile range. (b) Beta diversity. Principal coordinates analysis (PCOA) between IVF and spontaneous cohorts. The figure shows the three-dimensional diagram of PCOA, in which each dot represents a sample, and each colour represents a group: red for spontaneous pregnancy group and blue for IVF group. PC1 is the principal coordinate component causing the largest difference in samples, with an explanatory value of 37.02%. PC2 and PC3 were next, with an explanatory value of 11.63% and 9.47%, respectively.

