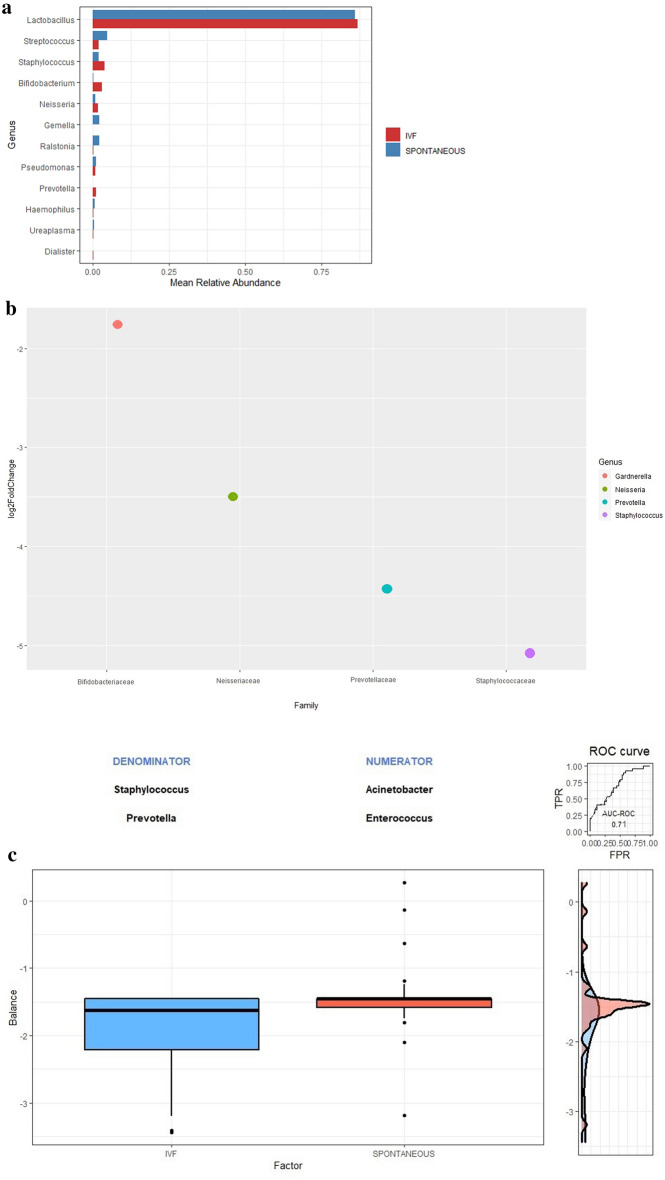
Figure 2.
Composition of the bacterial community at the genus level. (a) By cohort. (b) By differential taxa abundances. The plot shows the log2-fold changes for genus-level bacterial that were statistically significant at the 0.01 level using the Wald test with Benjamini–Hochberg adjustment as implemented in DESeq2. Each data point represents a genus-level (y-axis) identified as significantly different along with the log2 fold change (x-axis). Negative values indicate the log2 fold change for taxa underrepresented in vaginal microbiome at 12 weeks from patients with a spontaneous pregnancy. (c) By global balance. The two groups of taxa that form the global balance are specified at the top of the plot. The box plot represents the distribution of the balance scores for IVF and spontaneous pregnancies. The right part of the figure contains the ROC curve with its AUC value (0.71) and the density curve for each group.

