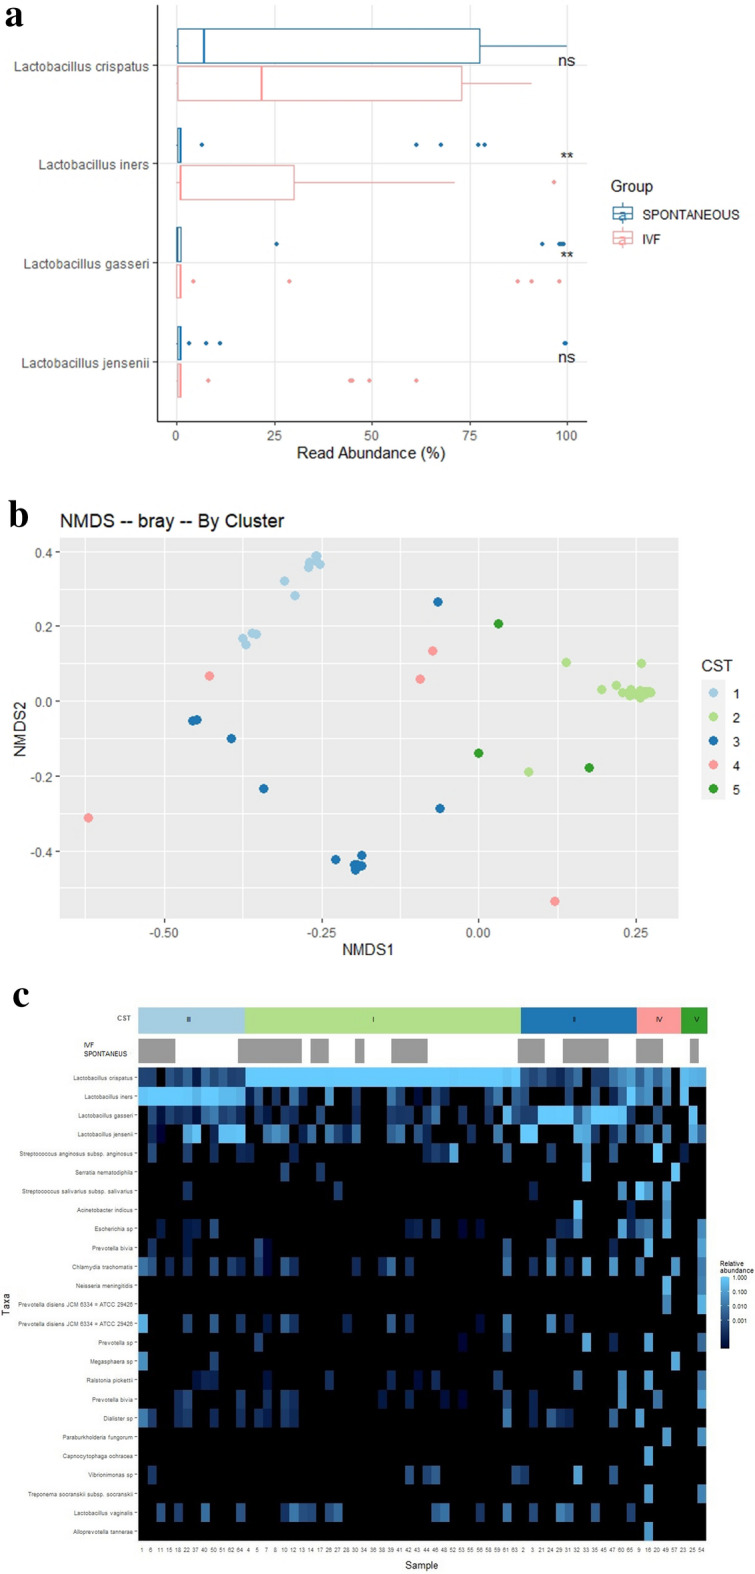
Figure 3.

Composition of the bacterial community. (a) At the Lactobacillus level. Boxplots showing the % of read abundance of Lactobacillus genus in vaginal microbiome at 12 weeks in the IVF vs in the spontaneous pregnancy group. Asterisks show statistical significant two-sided Wilcoxon’s test. (b) At the CST level. Principal Coordinate Analysis (PCoA) ordination based on Bray Curtis non-metric multidimensional scaling (NMDS) dissimilarities permutational multivariate analysis of variance (PERMANOVA) 999 permutations; p-value < 0.001). Samples belonging to different CSTs are indicated with different colour dots. (c) A heatmap of relative abundance of the top 25 species found in the vaginal samples of pregnant women at 12 weeks included in our study. Each vertical line represents 1 sample. CST, community state type, IVF and spontaneous group.
