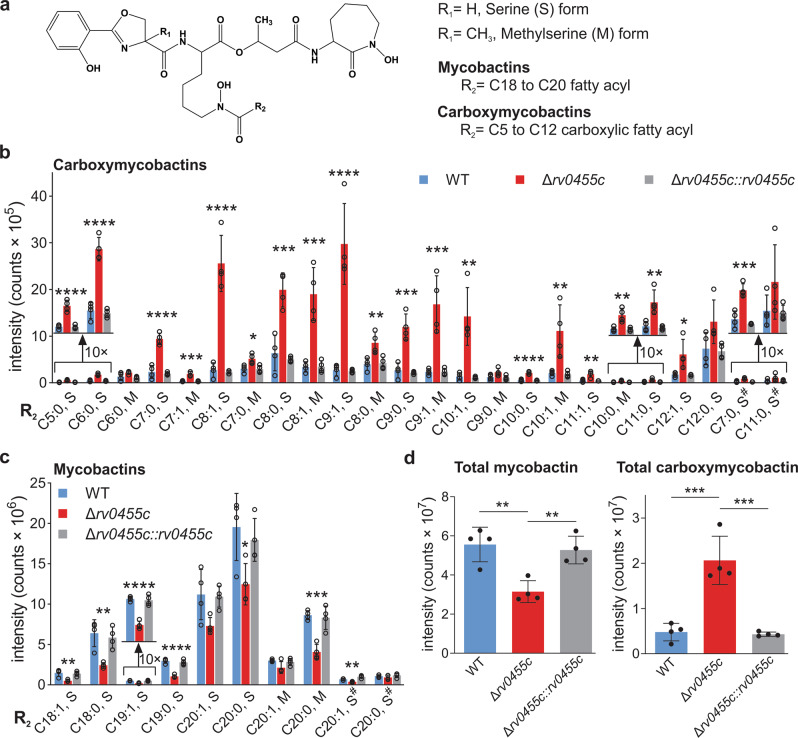
Fig. 4. Siderophore profile of the M. tuberculosis Δrv0455c mutant.
Whole-cell lipid extracts of M. tuberculosis mc26230, the Δrv0455c mutant, and the Δrv0455c mutant complemented with an integrated rv0455c expression vector were analyzed by lipidomics using high-performance liquid chromatography and mass spectroscopy. a Chemical structure of the core of M. tuberculosis siderophores. R1: H or CH3 represent the serine (S) or methylserine (M) form, respectively. R2: alkyl chains. The mean intensity values for molecular events are shown for a subset of carboxymycobactin isoforms (b) and mycobactin isoforms (c). The indicated fatty acid chain lengths (number of carbons) and the number of double bonds corresponding to mono- or di-carboxyl units assume the peptide structure shown in (a), which according to prior analyses is the dominant form12,55. The monodeoxy-mycobactins and monodeoxy-carboxymycobactins are indicated with a hash tag (#). d Total mycobactin and total carboxymycobactin counts in wt M. tuberculosis (blue), the Δrv0455c mutant ML2203 (red), and the complemented strain ML2205 (gray). Data are mean ± s.d. of four biological replicates. Asterisks indicate significant differences (*p < 0.05, **p < 0.01, ***p < 0.001, ****p < 0.0001 by one-way ANOVA with Tukey’s test) compared with wt M. tuberculosis. Source data are provided in the Source Data file.

