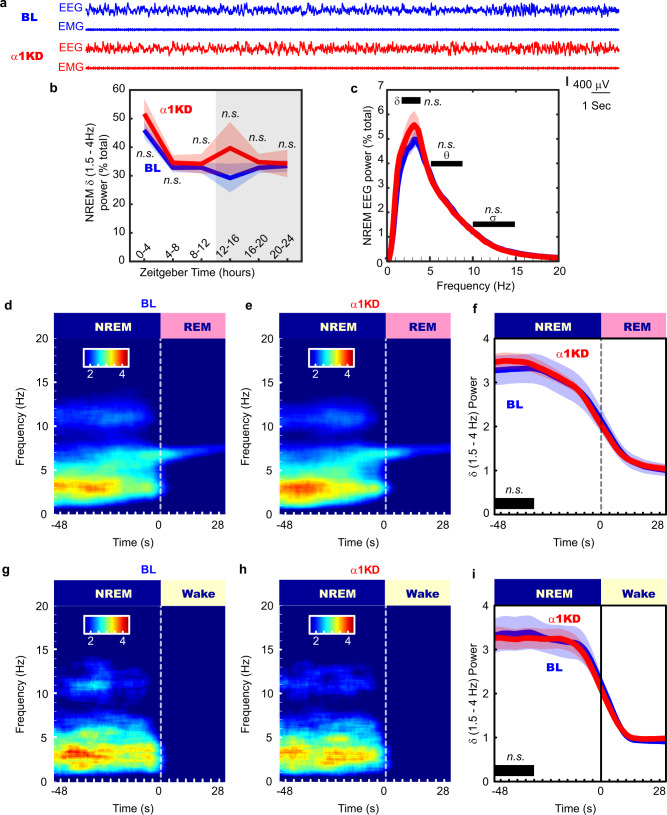
Fig. 5. The control cohort with α1KD in PV + TRN neurons displayed no changes to NREM or wake time, or delta (δ, 1.5–4 Hz) power in any states, including transitions from NREM to REM, in the light (inactive) period.
a Examples of frontal electroencephalogram (EEG) and electromyogram (EMG) recordings during a NREM period (ZT0-4) in baseline (BL; blue) and following α1KD (red), from a single mouse. b Compared with their baseline (BL) recordings, α1KD mice had unchanged non-rapid eye movement sleep (NREM delta power ZT0-4, p = 0.2; ZT4-8, p = 0.32; ZT8-12, p = 0.58; ZT12-16, p = 0.42; ZT16-20, p = 0.47; ZT20-24, p = 0.88. Significance was determined using two-tailed paired t-tests. Thick lines indicate mean; envelopes indicate SEM. The shaded area indicates the 12 h dark period. c NREM delta (δ) theta (θ) and sigma (σ) power were not different between BL and α1KD records, shown here is the power profile from NREM in ZT-0-4 when we saw the largest effect in the α3KD mice. Significance was determined using two-tailed paired t-tests. Thick lines indicate mean; envelopes indicate SEM. d Baseline time-frequency power dynamics reveal high delta power in NREM leading to a transition to rapid eye movement (REM) sleep. e After α1KD, the high delta power in NREM before a transition to REM is the same as in baseline records. f Compared with baseline (blue), α1KD (red) mice had unaltered delta power in the NREM before a transition to REM [t (6) = 0.67, p = 0.26]. Significance was tested using a one-tailed paired t-test. Thick lines indicate mean; envelopes indicate SEM. g Baseline time-frequency power dynamics reveals high delta power in NREM leading to a transition to wake. h α1KD did not increase the delta in NREM before a transition to wake. i Compared with baseline (blue), α1KD (red) mice had unchanged delta power in the NREM before a transition to wake [t (6) = −0.36, p = 0.63]. Significance was tested using a one-tailed paired t-test. Thick lines indicate mean; envelopes indicate SEM. n.s. indicates not significant. d–i show data from whole 12 period of light. b–i N = 7. Color scales represent normalized power (power at time/power from wakefulness).

