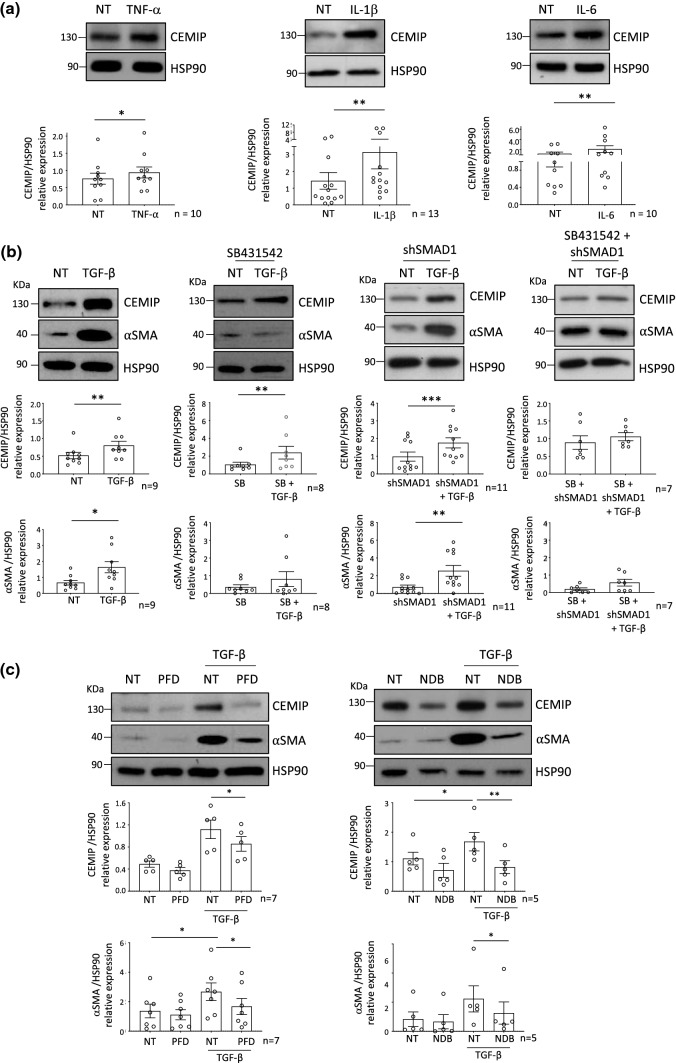
Fig. 6.
Regulation of CEMIP expression. Western blot analysis of CEMIP expression after 1 day of TNF-α (n = 10), IL-1β (n = 13) and IL-6 (n = 10) stimulation (a). Western blot analysis of CEMIP and αSMA expression after 7 days of TGF-β stimulation (n = 9); after treatment with SB431542 (SB) and with or without TGF-β for 7 days (n = 8); in SMAD1 silenced cells (shSMAD1) treated or not with TGF-β for 7 days (n = 11) and in SMAD1 silenced cells (shSMAD1) pretreated with SB431542 (SB) and treated or not with TGF-β for 7 days (n = 7) (b). Western blot analysis of CEMIP and αSMA expression after Pirfenidone (PFD) treatment with or without TGF-β stimulation (n = 5) and after Nintedanib (NDB) treatment with or without TGF-β stimulation (n = 5) (c). Western blot quantifications illustrate the expression of the different proteins normalized to HSP90 expression (loading control). Data are expressed as mean with SEM. Parametric paired t test, for two groups comparisons or paired ANOVA test followed by Tukey post hoc test, for multiple comparisons (for values that pass normality test) or non-parametric Wilcoxon test, for two group comparisons or paired Friedman test followed by Dunn’s post hoc test, for multiple comparisons (for values that did not pass normality test) were applied. *p < 0.05, **p < 0.01 and ***p < 0.001

