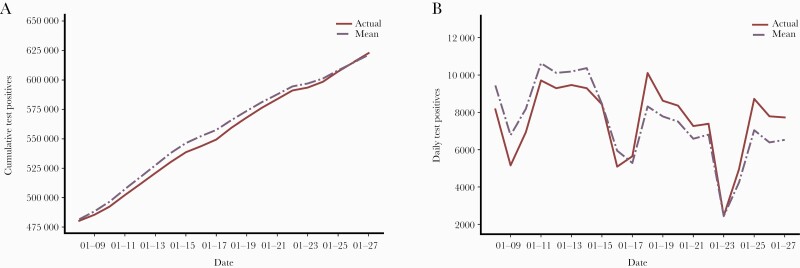
Figure 4.
Comparison of actual SARS-CoV-2 infections and simulated counts during January 8–January 28, 2021. Comparison of simulated cumulative counts of positive counts and daily counts of positive tests with true counts is shown. As of January 8, 2021, the cumulative count of positive tests was 480 338. As demonstrated in the figure, the simulated trajectories lie close to the true counts of cumulative positive tests. The solid red line shows the actual trajectories. The means of the simulated trajectories are shown as a broken line in purple. The shaded blue regions indicate 75% confidence around the mean trajectory. A, Comparison of the cumulative counts of positive counts against the true counts. B, Comparison of the fitted daily counts of positive tests against true counts of daily positive tests. The dips in the counts are due to weakened effects. Even though the true trajectory of daily counts of positive tests is unsmooth, the simulated counts of daily positive tests are generally close to it. In particular, the true trajectory lies entirely within the 75% confidence bounds, indicating a good fit of the model to the data. Abbreviations: COVID-19, coronavirus disease 2019; SARS-CoV-2, severe acute respiratory syndrome coronavirus 2.

