
Figure 1.
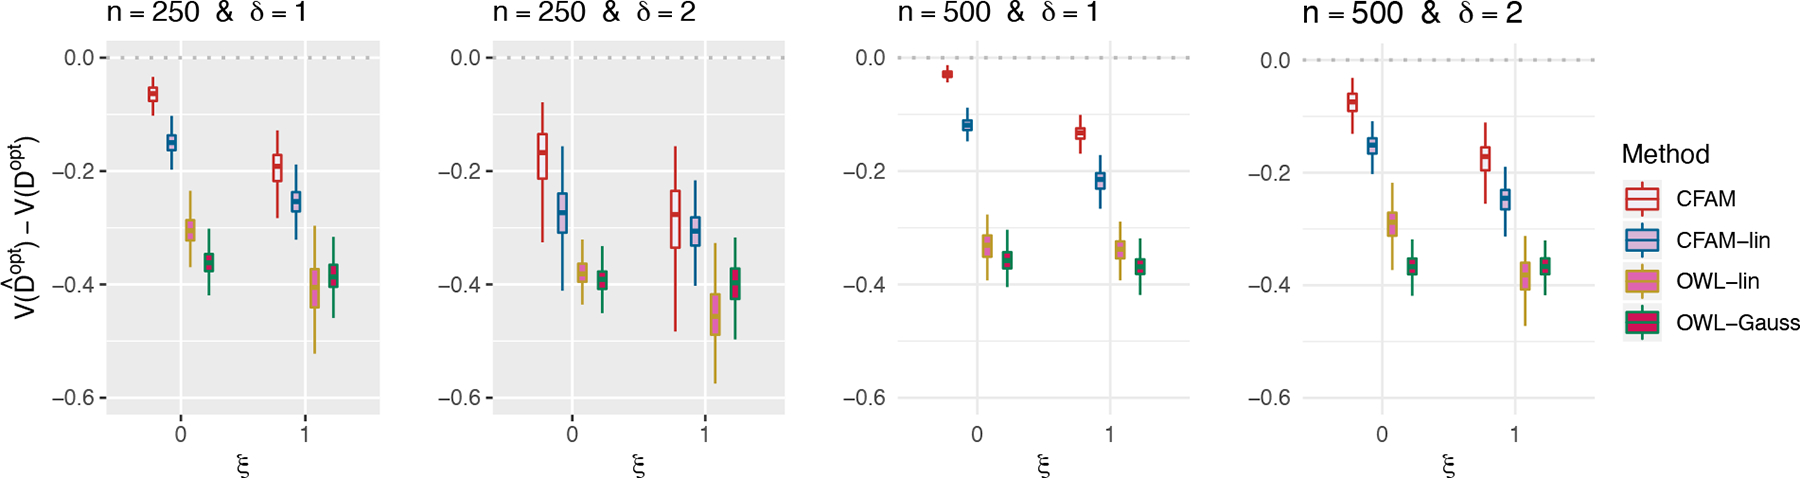
Boxplots obtained from 200 Monte Carlo simulations comparing 4 approaches to estimating , given each scenario indexed by ξ ∈ {0, 1}, δ ∈ {1, 2} and n ∈ {250, 500}. The dotted horizontal line represents the optimal value corresponding to .
Official websites use .gov
A
.gov website belongs to an official
government organization in the United States.
Secure .gov websites use HTTPS
A lock (
) or https:// means you've safely
connected to the .gov website. Share sensitive
information only on official, secure websites.
Boxplots obtained from 200 Monte Carlo simulations comparing 4 approaches to estimating , given each scenario indexed by ξ ∈ {0, 1}, δ ∈ {1, 2} and n ∈ {250, 500}. The dotted horizontal line represents the optimal value corresponding to .