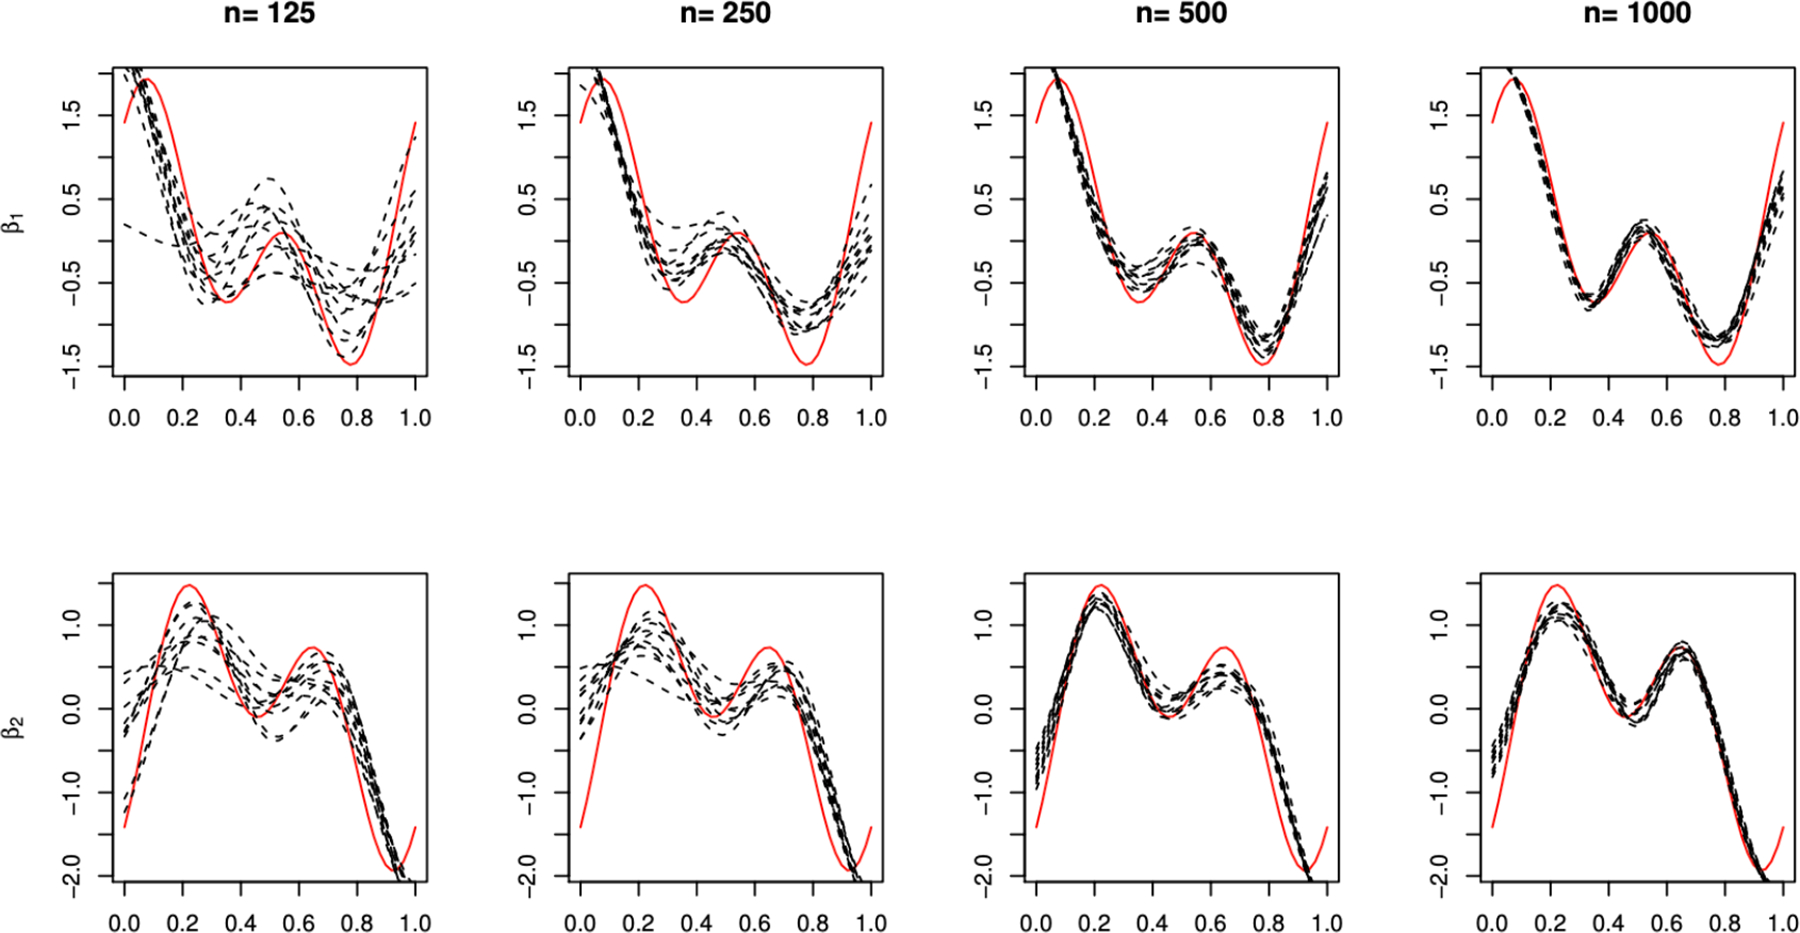
Figure 2.

An illustration of typical 10 CFAM sample estimates (black dashed curves) for the parameters βj(s) (the red solid curves), for j = 1 and 2 in the top and bottom panels, respectively, with a varying training sample size n ∈ {125, 250, 500, 1000} for the case of δ = 1.
