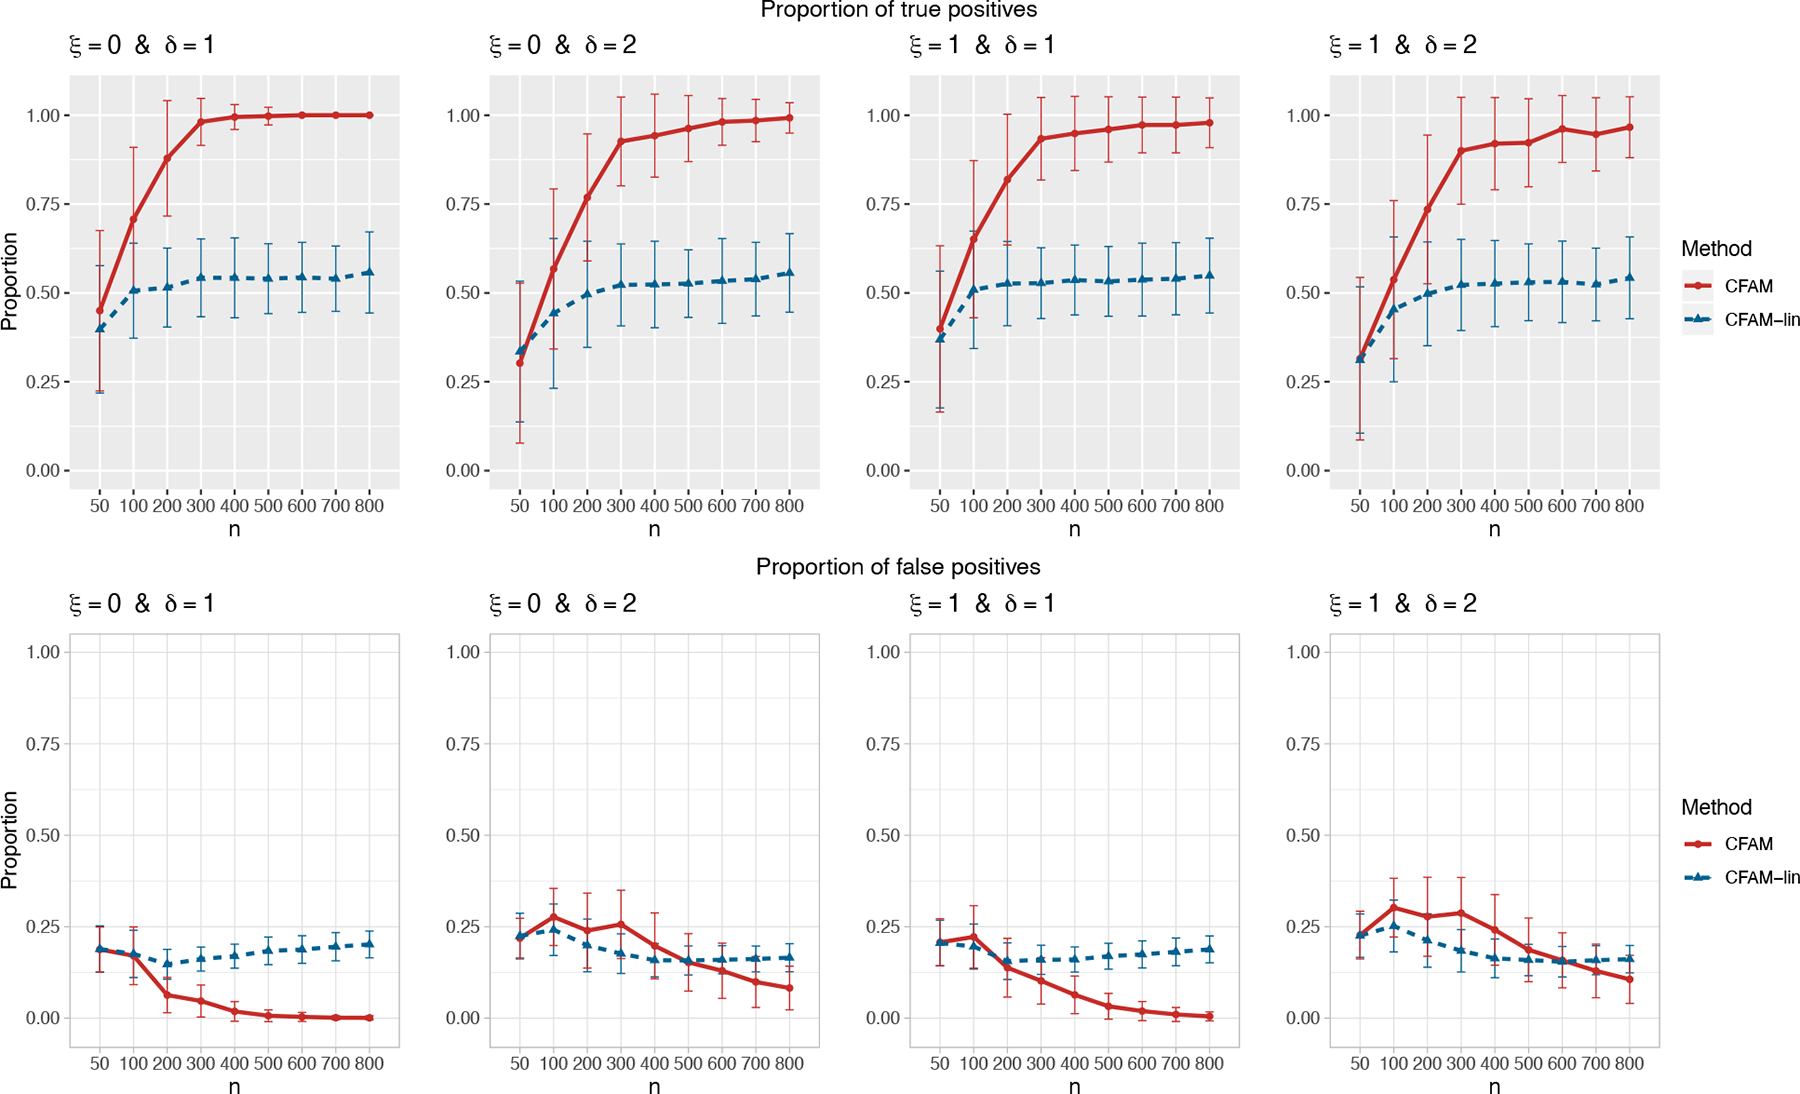
Figure 3.

The proportion of the relevant covariates (i.e., the treatment effect-modifiers) correctly selected (the “true positives”; the top gray panels), and the “noise” covariates incorrectly selected (the “false positives”; the bottom white panels), respectively (and ±1 standard deviation), with a varying sample size n ∈ {50, 100, 200, …, 800}, for each combination of ξ ∈ {0, 1} and δ ∈ {1, 2}.
