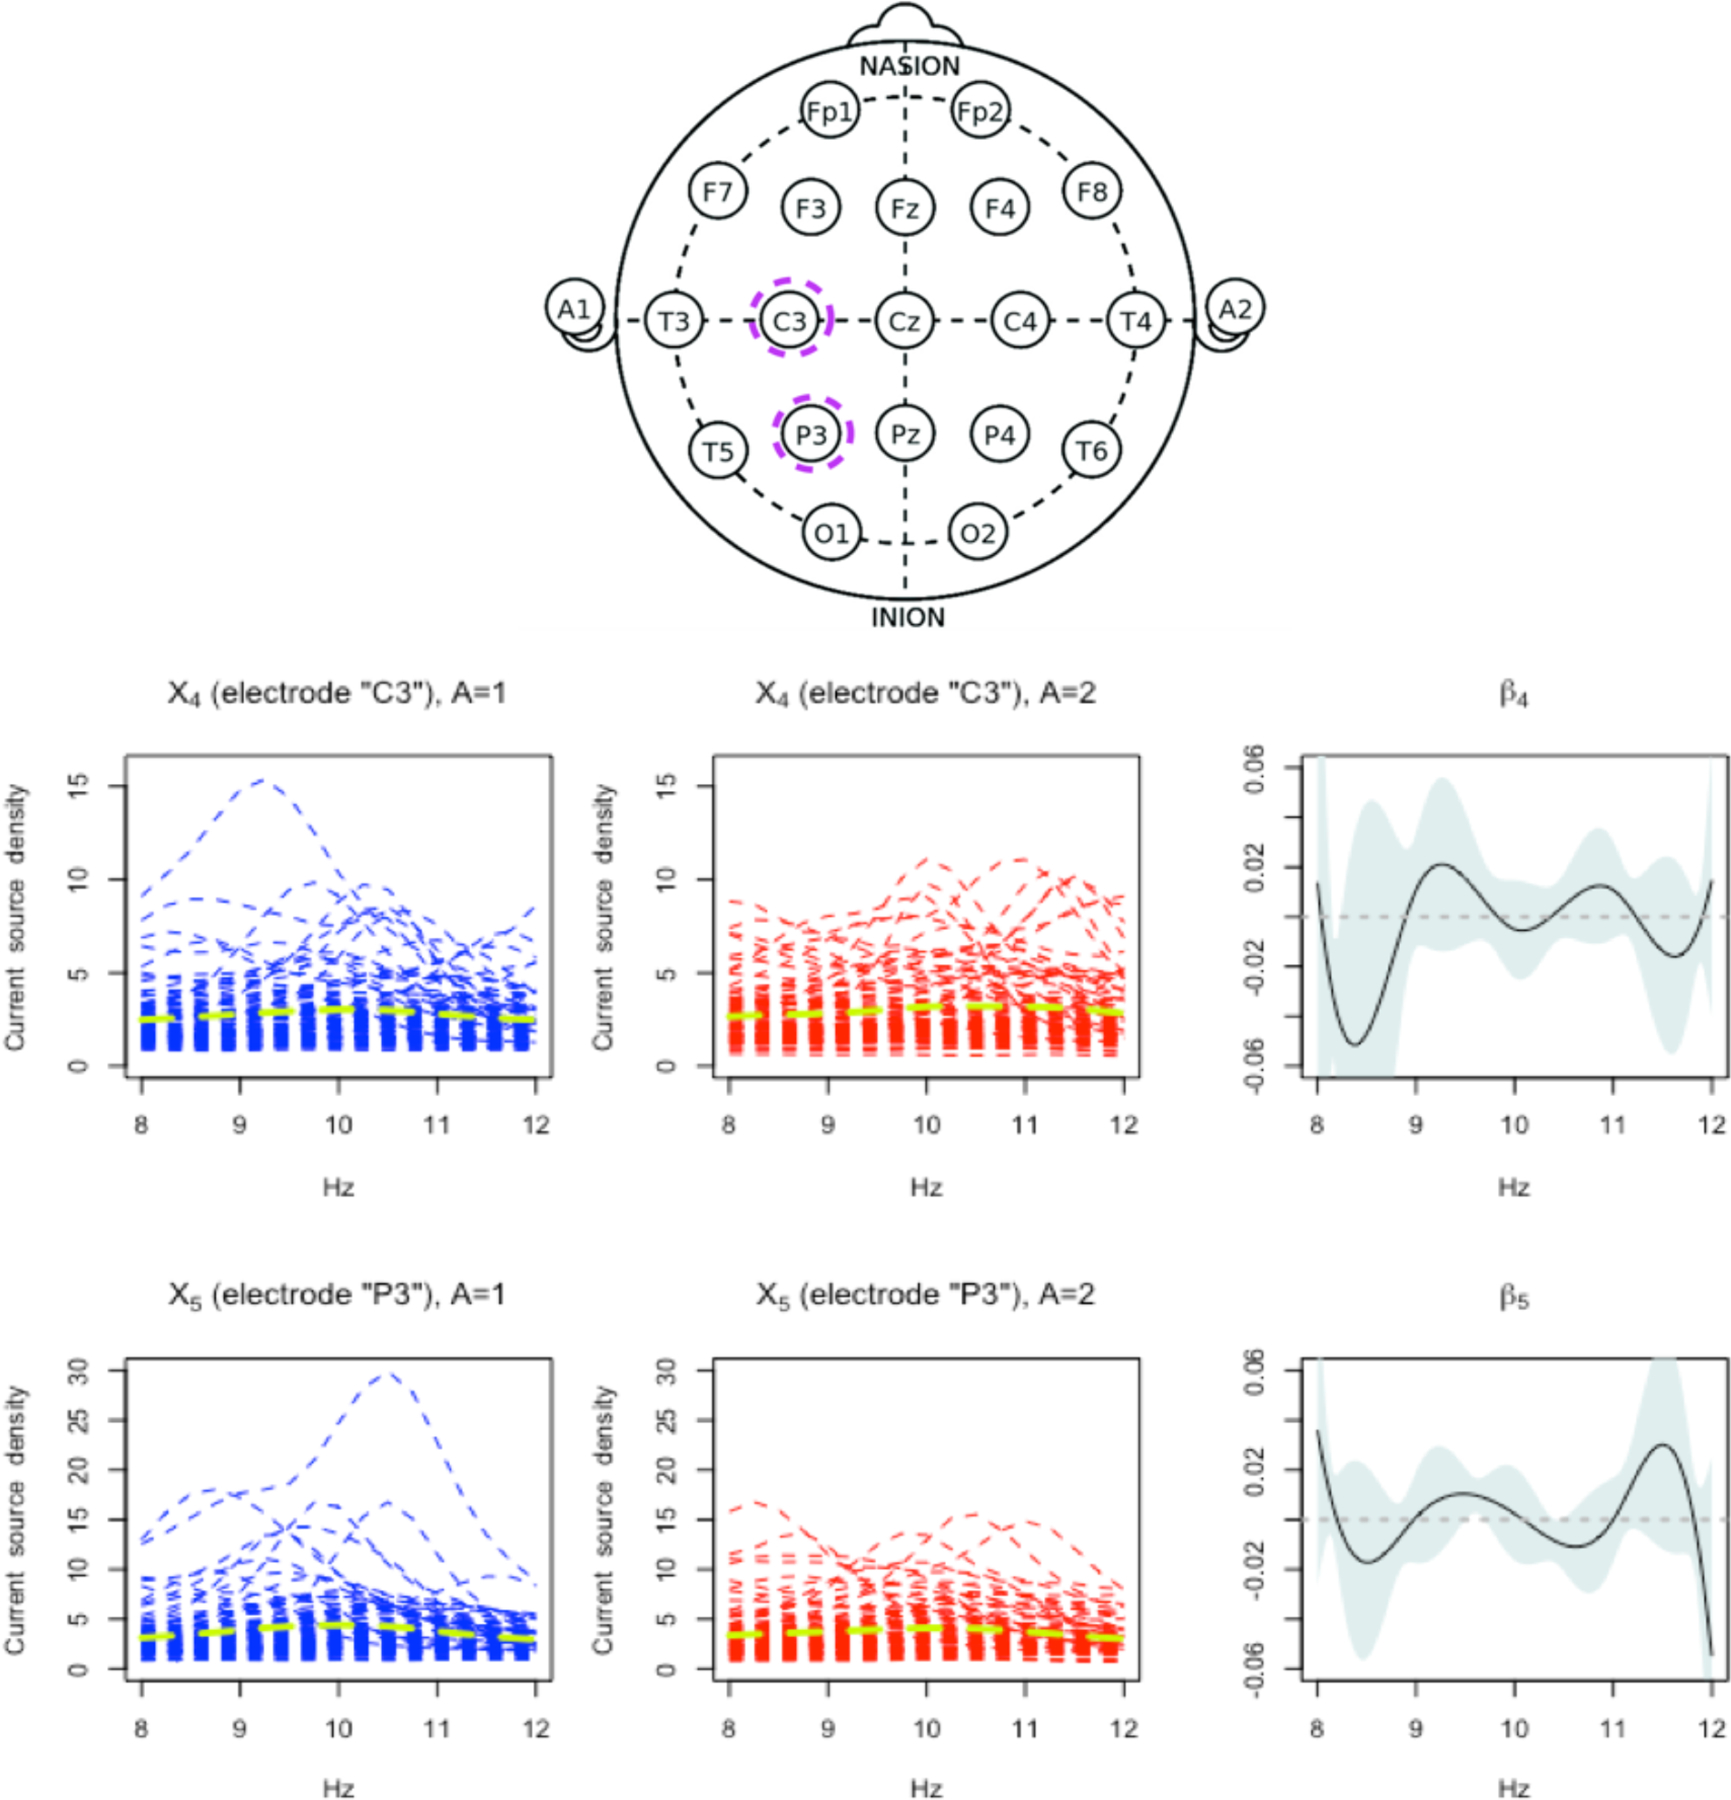
Figure 4.

Top row: The locations for the 19 electrode channels (“A1” and “A2” were not used). Those 2 electrodes (“C3” and “P3”) highlighted in dashed violet circles are the selected electrodes from the proposed approach. Bottom rows: First two columns: observed current source density (CSD) curves from the selected electrodes X4 (“C3”) and X5 (“P3”) (each electrode corresponds to each row), over the Alpha band (8 to 12 Hz), for the placebo A = 1 arm (in the first column) and the active drug A = 2 arm (in the second column), measured before treatment. The arm-specific mean functions are overlaid as dashed green curves. Third column: the estimated single-index coefficient functions (β4 and β5) for the selected channels X4 and X5 (with the associated 95% confidence bands, conditioning on the jth partial residual and ).
