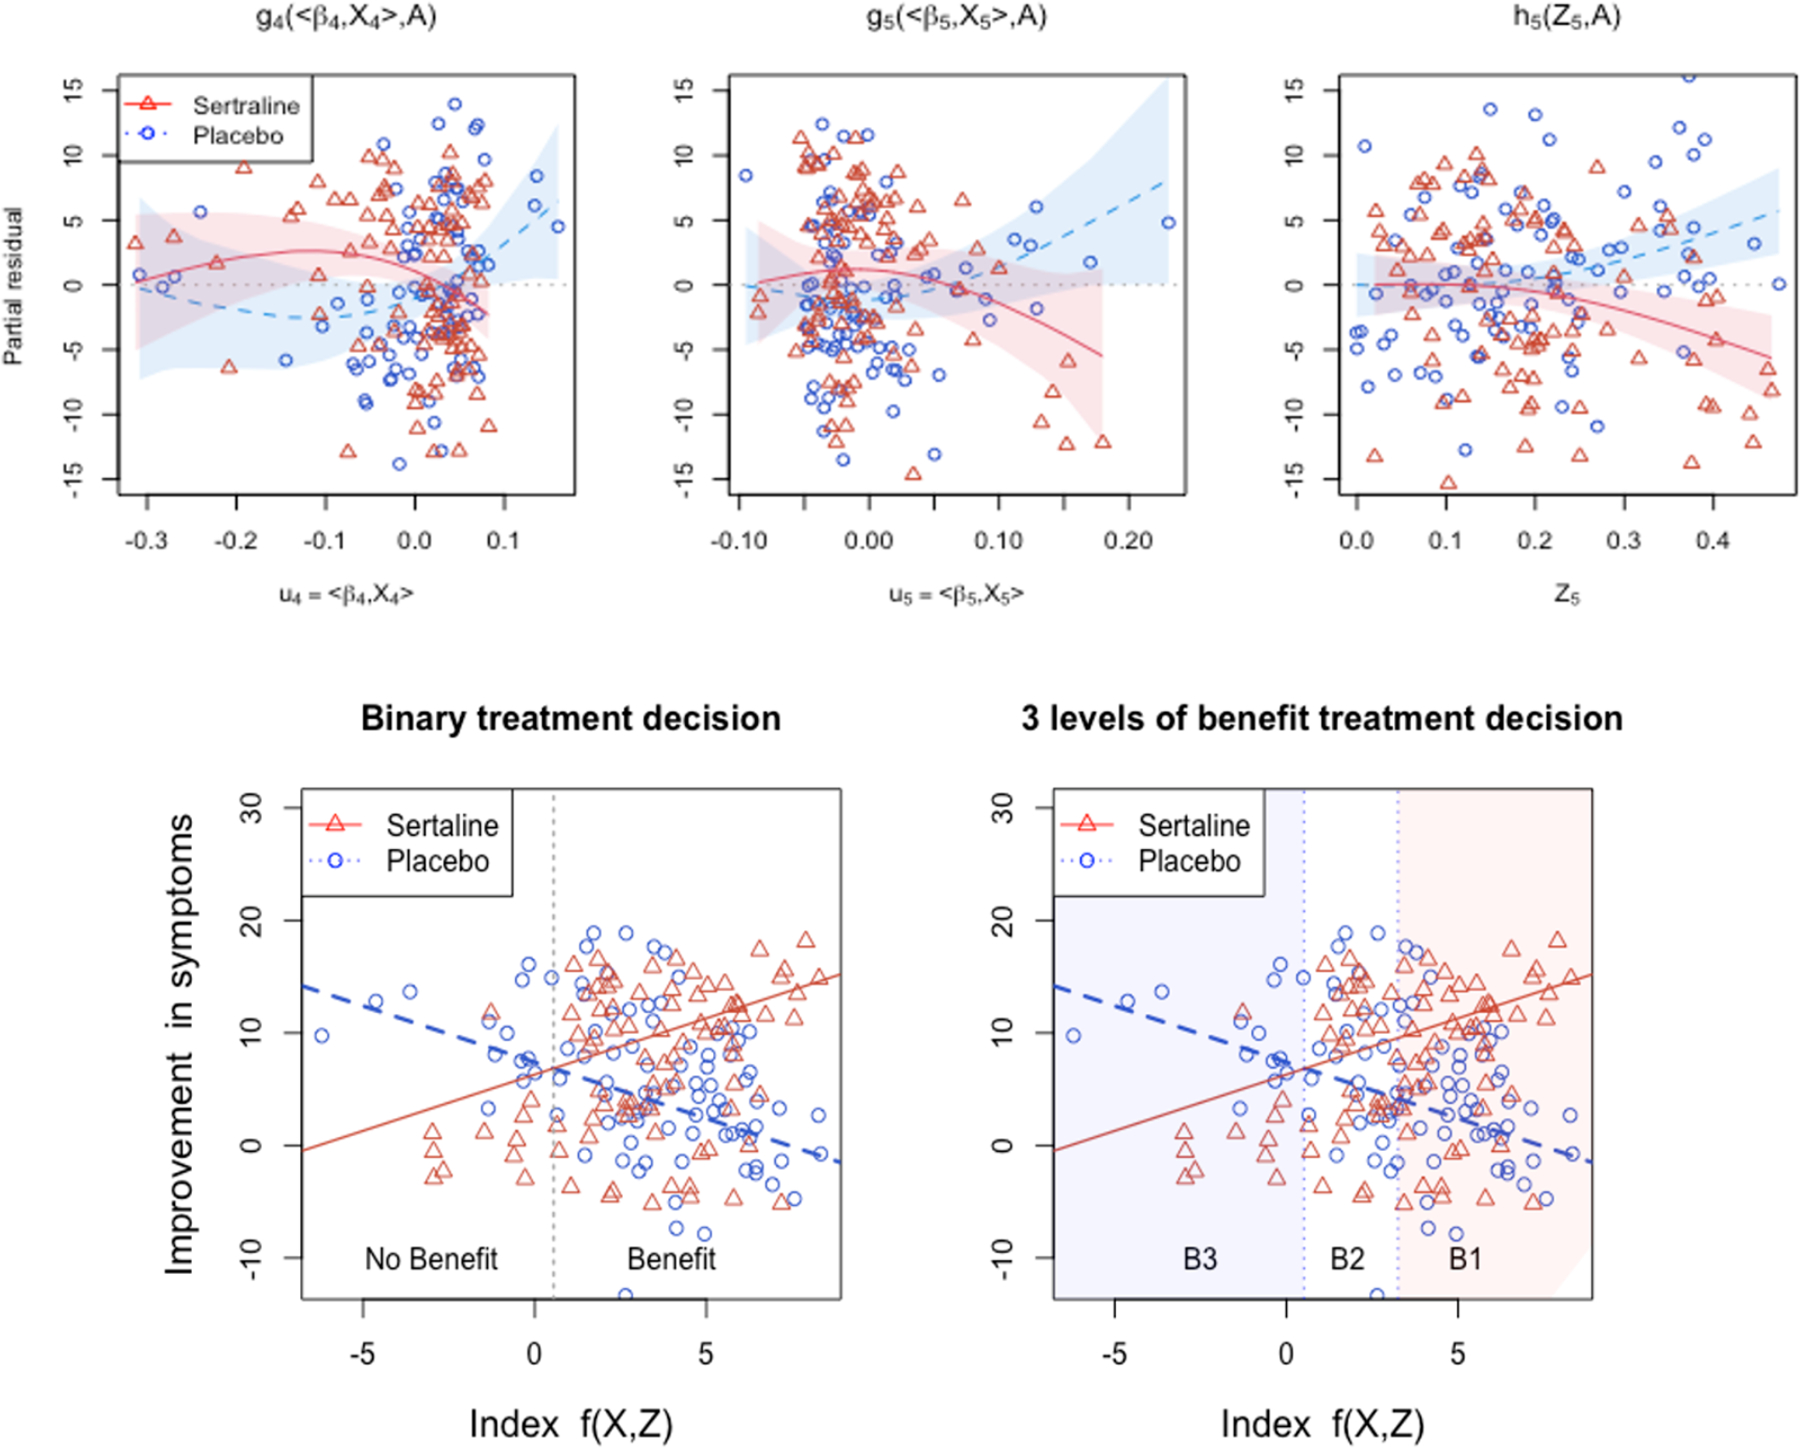
Figure 5.

Top row: The scatter plots of the (jth; j = 4, 5) (and kth; k = 5) partial residual vs. the estimated functional indices u4 = 〈X4, β4〉 and u5 = 〈X5, β5〉 (and Z5), respectively, for the placebo A = 1 (blue circles) and sertraline A = 2 (red triangles) treated individuals. The estimated nonzero treatment-specific component functions g4(u4, A), g5(u5, A) and h5(Z5, A) are overlaid separately for the A = 1 (placebo; blue dotted curve) condition and the A = 2 (sertraline; red solid curve) condition (with the associated 95% confidence bands, given the partial residuals and ). Bottom row: The scatter plots of the observed treatment-specific response Y vs. the “index” f(X, Z) = g4(〈X4, β4〉, 2) + g5(〈X5, β5〉, 2) + h5(Z5, 2), with possible two-group recommendation grouping (in the left panel; the cut-point was the crossing point= 0.56 between the two treatment-specific expected responses) and possible three-group recommendation grouping (in the right panel; the cut-point for B2 and B1 was 3.15, which gives the difference(= 7.42) in the two treatment-specific expected responses larger than the expected marginal response under sertraline(= 7.41); note that this cut-point choice was just for an illustration of the idea of the benefit stratification).
