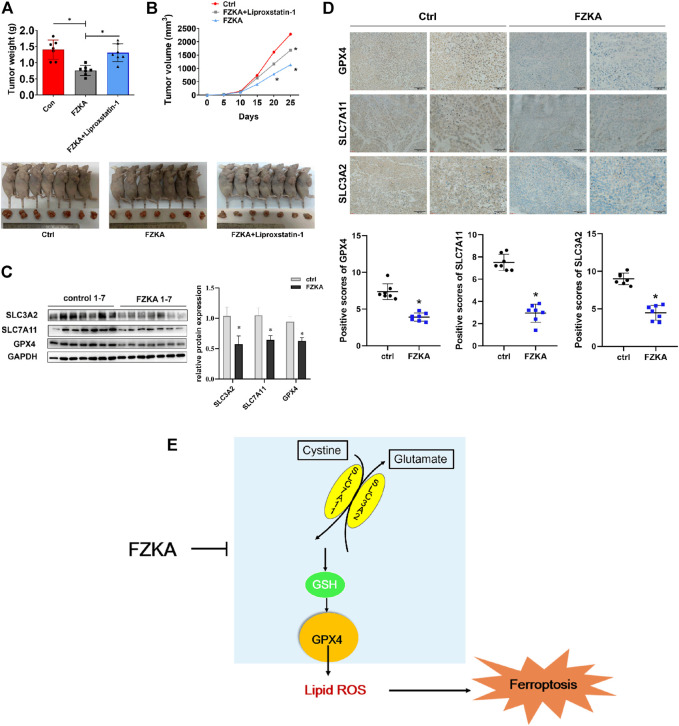
FIGURE 7.
Validation of FZKA-induced NSCLC cell ferroptosis in vivo. (A), Mice tumor photograph and tumor weight was showed. Data represents Mean ± SEM, n = 7. *p < 0.05. (B), Tumor volume in each group was showed. Data represents Mean ± SEM, n = 7. *p < 0.05. (C), Western blot analyses of GPX4, SLC7A11 and SLC3A2 expression from tumor tissues. Data represents Mean ± SEM, n = 7. *p < 0.05. (D), Immunohistochemistry was carried out to measure the expression of GPX4, SLC7A11 and SLC3A2 in mice tumor tissues. Data represents Mean ± SEM, n = 7. *p < 0.05. (E), The diagram showing FZKA induced NSCLC cell ferroptosis through system xc−/GSH/GPX4 axis, and, importantly, GPX4 is the crucial molecular in the process. Finally, inhibition of GPX4 by FZKA leads to NSCLC cell ferroptosis.

