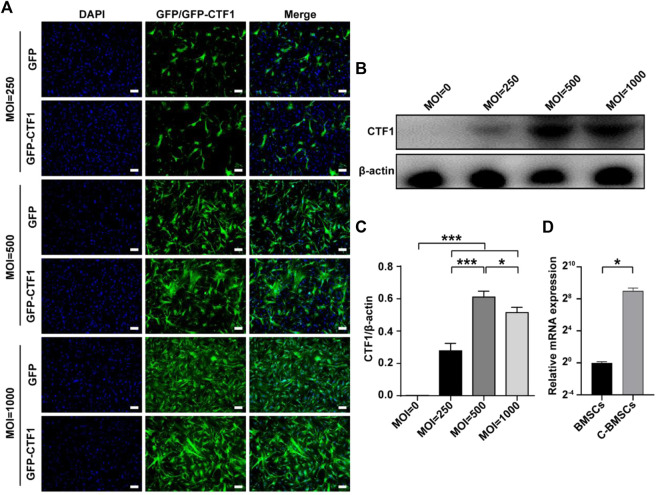
FIGURE 2.
Stable adenoviral overexpression of CTF1 in BMSCs. (A) Transduction ratios for cells overexpressing CTF1 or GFP (as a control). (B–D) Western blotting (n = 3, independent biological replicates) and qPCR (n = 3, technical replicates) were used to confirm the increased expression of CTF1 in C-BMSCs relative to control BMSCs (p < 0.05). Scale bar = 100 μm. *p < 0.05, **p < 0.01, ***p < 0.001.

