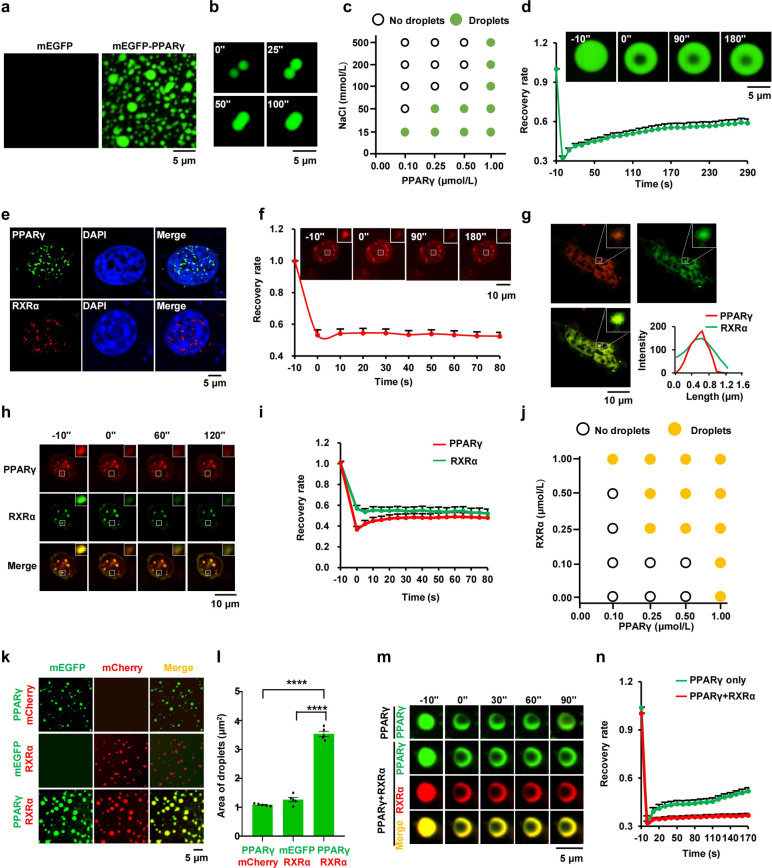
Fig. 1. PPARγ phase separated with RXRα in vitro and in cells.
a Representative images of droplet formation as indicated (5 μmol/L protein, 150 μmol/L NaCl, 10% PEG-8000). b Time-lapse micrographs of merging droplets (5 μmol/L protein, 150 μmol/L NaCl, 10% PEG-8000). c Phase diagram of PPARγ in the presence of different concentrations of NaCl, displaying phase separation potential of the protein is dependent on salt concentration (10% PEG-8000). d Quantifications of changes in the fluorescence measurement of mEGFP-PPARγ droplets after photobleaching were plotted over time (10 μmol/L protein, 150 μmol/L NaCl). The background was subtracted from the fluorescence measurement. Values represent means ± SEM (n = 15). Scale bar, 5 μm. e Immunofluorescence assay for PPARγ (green) or RXRα (red) in fixed 3T3-L1 cells. Fluorescence signal is shown alone (left) or merged with DAPI stain (right). f FRAP recovery images and recovery curve of nuclear mCherry-PPARγ condensates. The dotted square displays the region of photobleaching. Data are shown as means ± SEM (n = 15). Scale bar, 10 μm. g Confocal images of 3T3-L1 adipocytes transfected with mCherry-PPARγ and mEGFP-RXRα for 48 h (n = 20). Scale bar, 10 μm. h FRAP analysis of PPARγ/RXRα condensates. The dotted square displays the region of photobleaching. Scale bar, 5 μm. i Quantification of changes in the fluorescence measurement of PPARγ/RXRα condensates after photobleaching were plotted over time. The background was subtracted from the fluorescence measurement. Values represent means ± SEM (n = 15). j Phase diagram of PPARγ in the presence of different concentrations of RXRα (150 μmol/L NaCl, 10% PEG-8000). k Representative fluorescence microscopy images of a mixture of mEGFP-PPARγ/mCherry, mEGFP/mCherry-RXRα and mEGFP-PPARγ/mCherry-RXRα (2 μmol/L protein, 150 μmol/L NaCl, 10% PEG-8000), respectively. Scale bar, 5 μm. l Column scatter charts display average droplet area of each image related to panel k. Data are shown as means ± SEM (n = 5). m FRAP analysis of PPARγ alone or PPARγ/RXRα droplets (5 μmol/L protein, 150 μmol/L NaCl, 10% PEG-8000). Scale bar, 5 μm. n Quantification of changes in the fluorescence measurement of PPARγ alone or PPARγ/RXRα droplets after photobleaching were plotted over time. The background was subtracted from the fluorescence measurement. Values represent means ± SEM (n = 15). One-way analysis of variance (ANOVA) for panel l. *P < 0.05, **P < 0.01, ***P < 0.001, ****P < 0.0001. ns, not significant.

