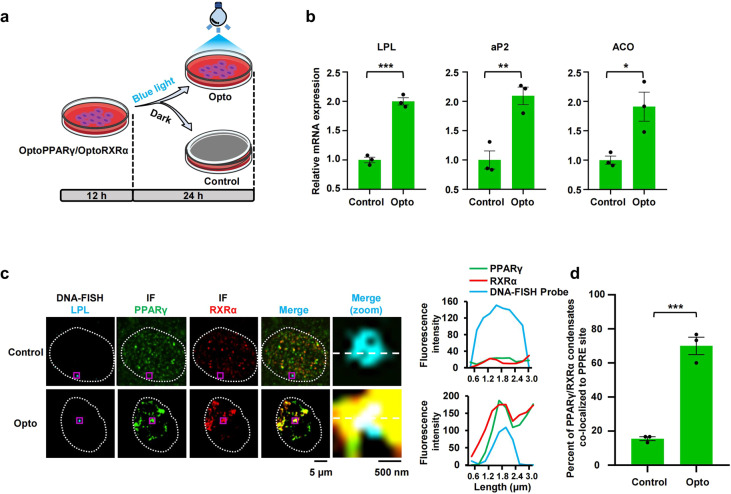
Fig. 4. Enforced formation of PPARγ/RXRα condensates remarkably generate specific downstream outcomes.
a Schematic timeline of seeding and blue light illumination of pre-3T3-L1 cells. 3T3-L1 cells with stable expression of optoPPARγ and optoRXRα were seeded in the dish for 12 h and then treated by blue light for 24 h. Dark-treated cells were referred as Control, and blue light-treated cells were referred as Opto. b RT-qPCR analysis of LPL, aP2, and ACO transcription levels in dark-treated cells and light-treated cells. Data are shown as means ± SEM (n = 3). c Colocalization between optoPPARγ/optoRXRα heterodimer puncta and LPL-PPRE locus by IF and DNA-FISH in fixed Control-3T3-L1 cell and Opto-3T3-L1 cell (n = 50). Separate images of the indicated LPL-PPRE probe (first column), PPARγ (second column) and RXRα (third column) are shown, accompanied with an image showing the merged channels (the fourth column, overlapping signal in white). Scale bar, 5 μm. The fifth column (merge (zoom)) displays the magnification of the purple box region in the fourth column for greater detail. Scale bar, 500 nm. Right panel, the line plot corresponding to magnified image. d Quantification of DNA-FISH analysis using percentage of cells with PPARγ/RXRα condensates and LPL-PPRE locus colocalization in fixed Control- and Opto-3T3-L1 cell (n = 3). Data are shown as means ± SEM. Statistics: two-tailed unpaired t-test. *P < 0.05, **P < 0.01, ***P < 0.001, ****P < 0.0001. ns, not significant.

