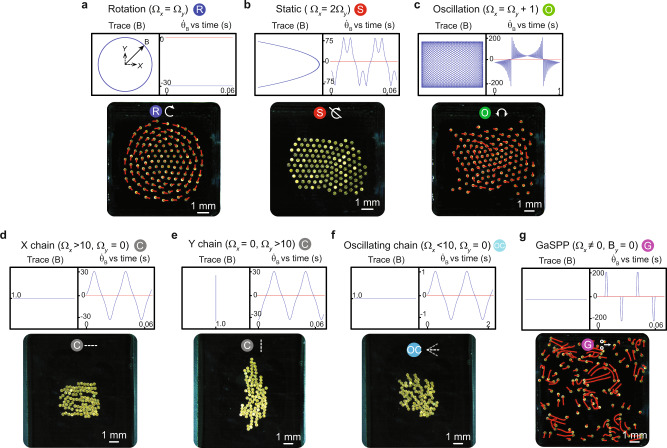
Fig. 3. Demonstration of different collective modes.
a–g Summary of collective modes: Curve traced by the magnetic field vector Trace(B) (top left), the derivative of the orientation of magnetic field vector (blue) with respect to the x-axis (red) (top right), representative experimental images of the collective exhibiting respective behaviors (bottom). The brightness of the images is enhanced using photoshop for better visualization. The symbols on top of the experimental images in (a–g) represent the mode that the collective exhibits. These symbols correspond to those shown in Fig. 1a. and are the oscillation frequencies of the external magnetic field along the and axes, respectively.

