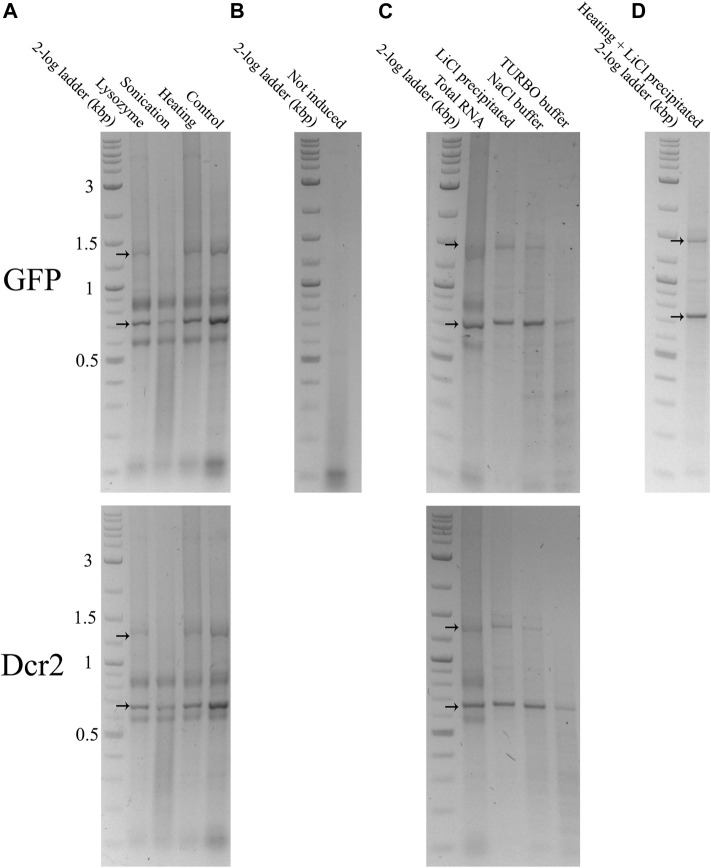
FIGURE 2.
Total and purified RNA extracted from HT115 (DE3) bacteria transformed with a L4440-GFP (upper gels) or L4440-HaDcr2 (lower gels) expression construct was loaded into 1% agarose gels in TAE buffer. The RNA was separated by size through electrophoresis at 120V for 2 h. The nucleic acids were imaged with the GelRed® (Biotium) stain under UV light. Arrows indicate the dsGFP and dsDcr2 bands at the ∼700 bp and ∼650 bp positions of the DNA ladder and the persistent secondary structure dsRNA band at ∼1,400 bp and ∼1,300 bp respectively. (A): 400 ng total RNA extracted from induced bacteria treated with a control protocol or three pre-treatments. (B): 400 ng total RNA extracted using the heating pre-treatment from non-induced bacteria. (C): Comparison between 400 ng total RNA extracted from induced bacteria with the heating pre-treatment and dsRNA purified from 400 ng total RNA through three purification methods. The band intensities indicate the efficiency of the applied dsRNA purification protocols. Thus, the “Heating” lane in panel A is equal to the “Total RNA” lane in panel (C). (D): 92 ng dsRNA purified from 400 ml of induced bacterial culture using the heating pre-treatment and LiCl precipitation.

