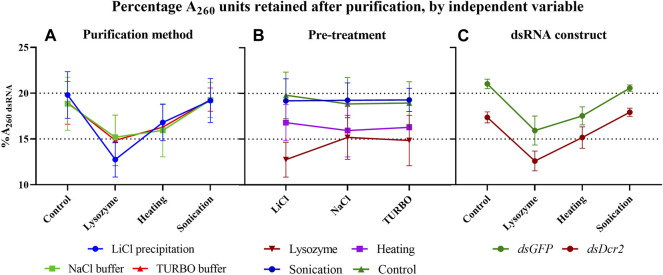
FIGURE 3.
In these graphs, the data of Table 1 are plotted to highlight the impact of the three independent variables (purification method, pre-treatment, and dsRNA construct) on the percentage of A260 units retained following dsRNA purification (%A260 dsRNA). When the data are sorted on the y-axis by one variable (pre-treatment for panel (A,C), or purification method for panel (B) and pooled as replicates by a second variable (dsRNA construct for panel A and B, or purification method for panel (C), the effect of the third variable can be visualized. Symbols indicate the mean, error bars the standard deviation. (A): The purification methods have no significant impact (p = 0.9945) on the %A260 dsRNA. (B): The pre-treatments have a major effect (p = 0.0007) on the %A260 dsRNA. (C): The GFP construct results in a higher %A260 dsRNA than the Dicer2 construct (p < 0.0001). Statistical analysis performed with a repeated measure two-way ANOVA.

