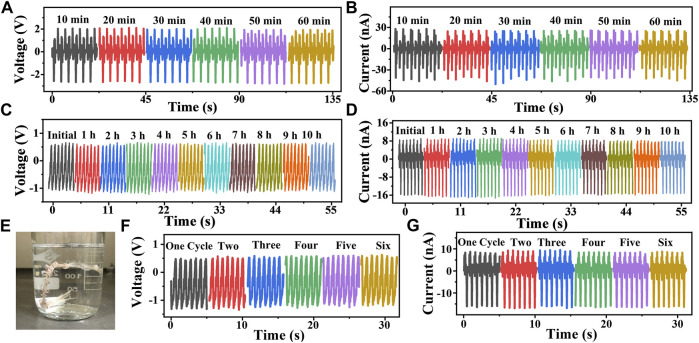
FIGURE 3.
Mechanical endurance of the TENG. (A,B) Voltage and current curves measured at 90% strain and 0.28 Hz after holding the TENG stretching at 90% strain for different time periods. (C,D) Voltage and current curves measured with the TENG that was kept working at 70% strain and 0.14 Hz for 10 h. (E) Photograph of the TENG while washing. (F–G) Voltage and current curves measured at 70% strain and 0.14 Hz after washing the TENG for different cycles.

