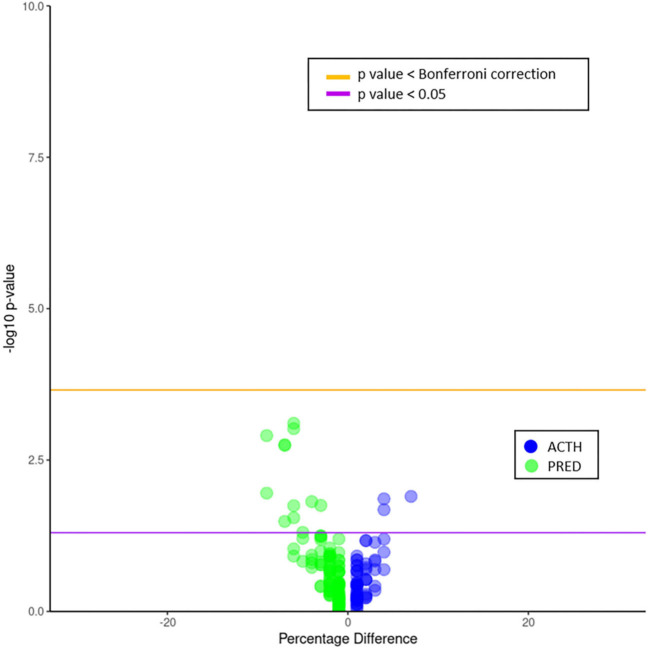
Figure 3.
Volcano plot of phecode differences between ACTH and PRED patients. Frequencies are plotted as negative log10 of the p-value over the percentage difference. The purple line indicates a p-value of 0.05; the orange line indicates an adjusted p-value using the Bonferroni correction. Neither drug cohort had phecode frequencies above the adjusted p-value. However, the PRED cohort had two neurological phecode frequencies above the p < 0.05 line, abnormal findings on study of brain/nervous system, and infantile cerebral palsy (percentage differences of 7% for both phecodes). The ACTH cohort also had a neurological phecode frequency above p < 0.05 line, hemiplegia (percentage difference of 4%).

