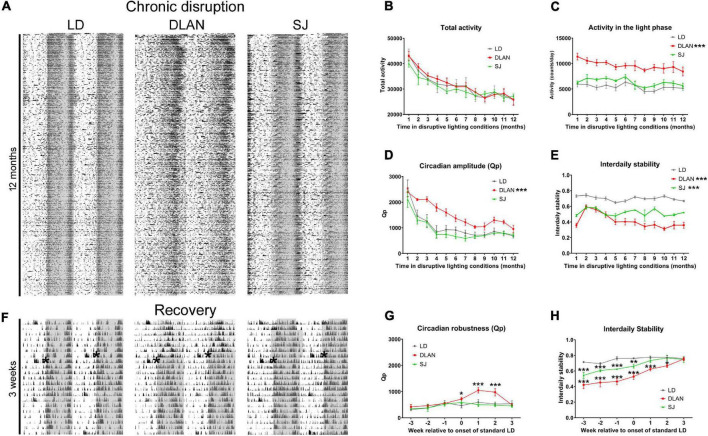
FIGURE 2.
Passive infrared recordings (PIR) monitoring during the 12-month lighting disruption period. (A) Representative actograms of group-housed mouse activity throughout the 12-month period of disruptive lighting. (B–E) Quantification of the PIR data over the 12 months of recording: total activity levels (B), activity in the light phase (C), circadian amplitude (Qp value) (D), and interdaily stability (E). (F) Representative actograms of the recovery period following the 12-month period of disruptive lighting. Actograms show the final week of activity under disruptive conditions and the following 2 weeks after return to standard LD conditions. Asterisks in the actograms of panel F denote the onset of standard LD conditions. (G,H) Quantification of PIR data of the recovery period: Qp (G) and interdaily stability (H). Data is presented as mean ± SEM. Repeated measures ANOVA (with Welch correction), groups: LD, DLAN, SJ. Post-hoc tests conducted with Benjamini-Hochberg corrections. ***p < 0.001, **p < 0.01, *p < 0.05.

