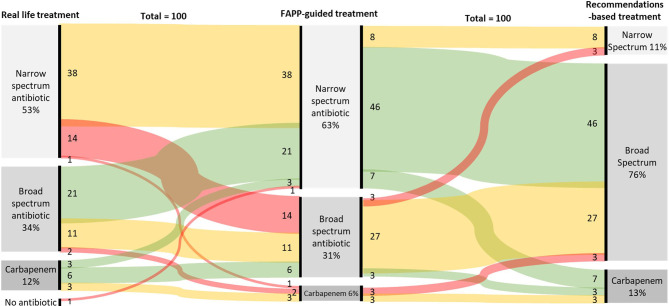
Figure 2.
Sankey chart of real-life empirical treatments implemented without FAPP (left column), antimicrobial therapies simulated with the results of FAPP (Middle column), and antimicrobial therapies simulated by following the actual recommendations (right column). Red lines stand for antibiotic escalation, green for de-escalation, and yellow for no changes.

