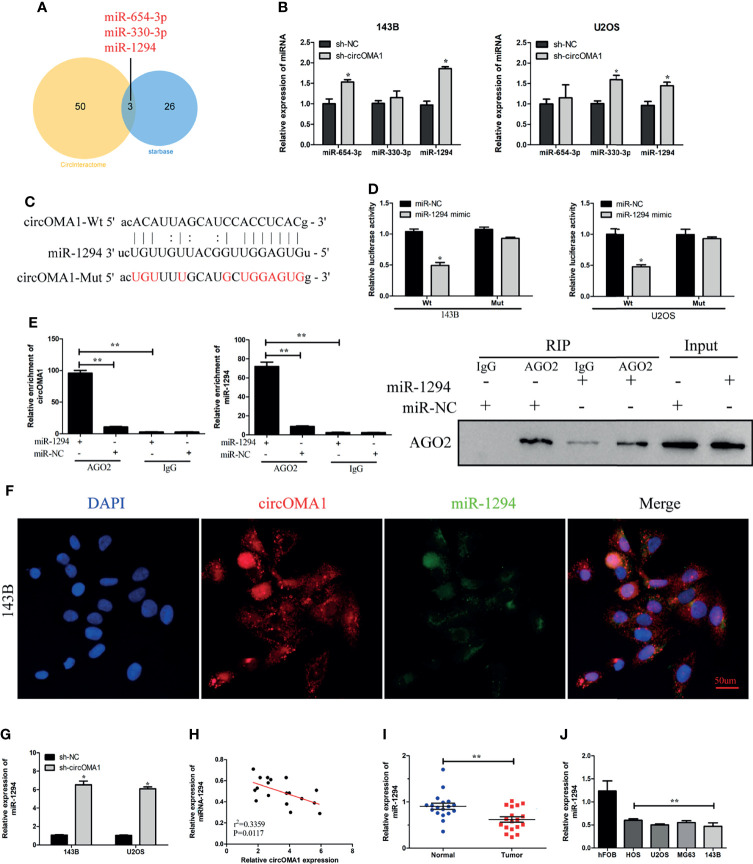
Figure 3.
circOMA1 sponged miR-1294 in OS cells. (A) The Venn plot demonstrated the overlapping miRNAs screened by Starbase and CircInteractome. (B) The expression of three potential miRNAs in transfected cells. (C) The binding sites between circOMA1 and miR-1294. (D) Luciferase activity could be identified in OS cells after co-transfection. (E) The binding between circOMA1 and miR-1294 was verified by RIP assay and immunoblotting. (F) The relationship between circZBTB40 and miR-1270 was assessed by the FISH assay. (G, H) miR-1270 expression in OS tissues and cell lines. (I) MiR-1294 expression was examined in OS cells after the knockdown of circOMA1. (J) The relationship between circOMA1 and miR-1294. *P < 0.05, **P < 0.01.

