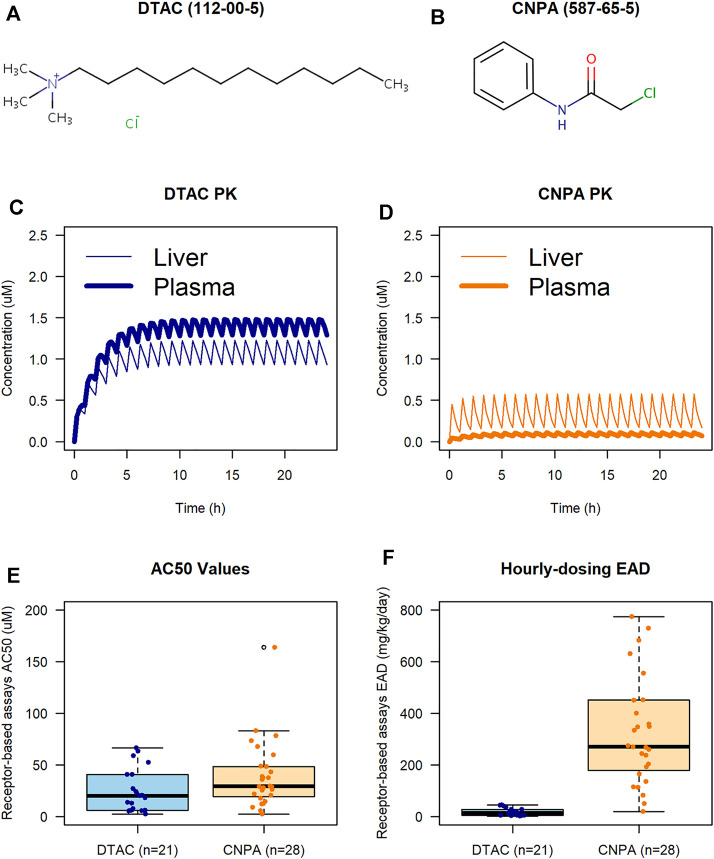
FIGURE 2.
PBPK and IVIVE case study results conducted in ICE. Chemical structures for DTAC and CNPA are from the EPA CompTox Chemical Dashboard [(A, B), respectively; CAS numbers shown in parentheses]. PK profiles show plasma (bold) and liver (plain) concentrations during the simulation for DTAC and CNPA [(C,D), respectively]. AC50 boxplot (E) shows similarity between observed bioactivity for receptor-based assays in DTAC and CNPA. Hourly-dosing EAD boxplot (F) shows how ADME considerations can result in different EAD predictions for chemicals with similar in vitro bioactivity.

