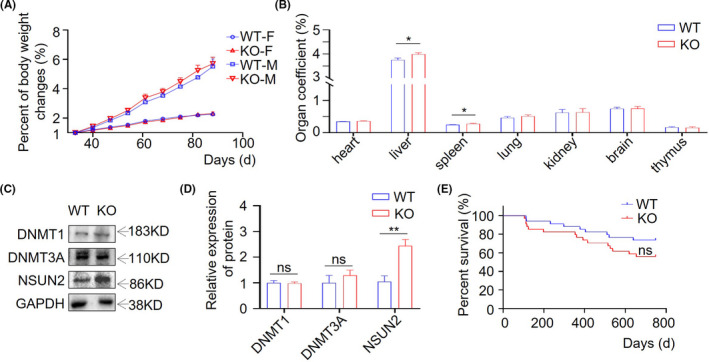
FIGURE 2.

The effect of Trdmt1 deletion on rat development and survival. A, Body weight changes of Trdmt1 gene knockout male and female rats (n = 3). F, female; M, male. B, The organ coefficient of 8‐10‐week‐old Trdmt1 gene knockout rats (n ≥ 5). C‐D, Protein level of DNMT1, DNMT3A, and NSUN2 in liver analyzed by western blot of Trdmt1 knockout rats. Quantitative analysis of DNMT1, DNMT3A, and NSUN2 protein expression level was analyzed by Image Lab software and using GAPDH for normalization. E, Survival curves of Trdmt1 gene knockout rats (n = 34). WT, wild‐type rats; KO, Trdmt1 knockout rats. Mean ± SEM; ns, not significant; *P < 0.05
