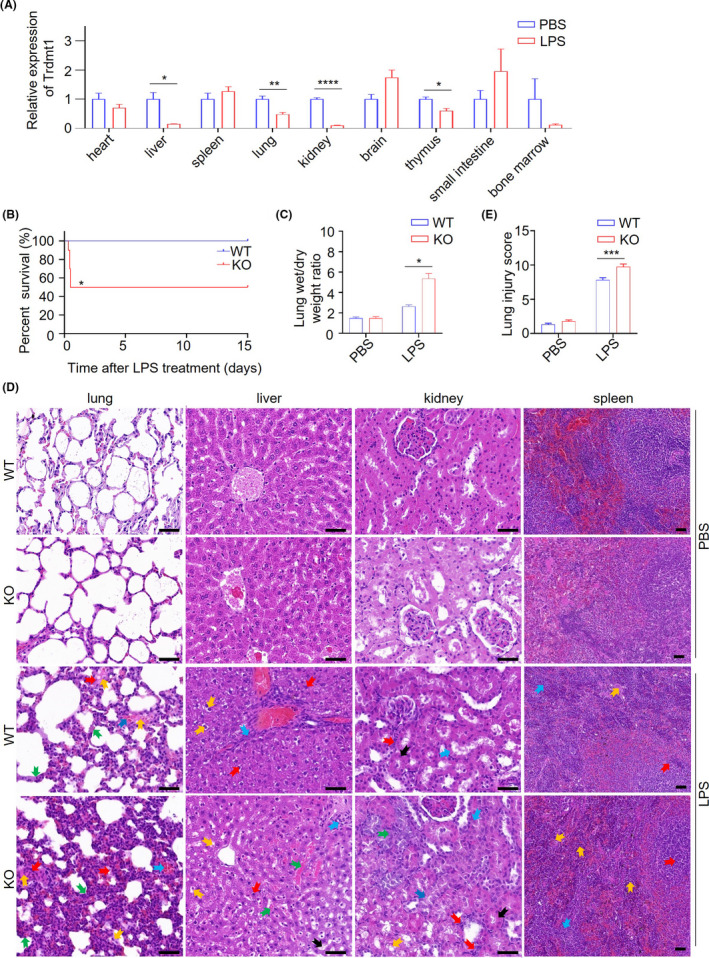
FIGURE 3.

Trdmt1 deletion leads to impaired response after LPS treatment in rats. A, The relative expression of Trdmt1 in LPS‐treated rats in heart, liver, spleen, lung, kidney, brain, thymus, small intestine, and bone marrow tissues (n = 3). B, Survival curve of Trdmt1 knockout rats after 5 mg/kg LPS treatment (n = 10). C, Lung wet/dry weight ratio of Trdmt1 knockout rats after 5 mg/kg LPS treatment (n ≥ 3). D, Representative images of HE staining of lung, liver, kidney, and spleen from Trdmt1 knockout rats with 1 mg/kg LPS or PBS treatment. In liver, labels indicate vacuolization of liver lobules (yellow arrow), infiltration of inflammatory cells (blue arrow), nuclei color change (red arrow), bleeding (green arrow), and hepatocyte degeneration (black arrow) in LPS‐treated groups; in lung tissue, labels indicate alveolar congestion (yellow arrow), alveolar hemorrhage (blue arrow), neutrophil infiltration (red arrow), and thickness of alveolar wall/hyaline membrane formation (green arrow) in LPS‐treated groups; in spleen tissue, labels indicate extramedullary hematopoietic foci (yellow arrow), splenic corpuscle in red pulp (blue arrow), and marginal zone thinning (red arrow) in LPS‐treated groups; in kidney, labels indicate vacuolization (yellow arrow), dilatation of renal tubules (blue arrow), neutrophil infiltration (red arrow), degeneration of renal tubules (green arrow), and tubular thickening (black arrow) in LPS‐treated groups. Scale bars, 50 μm. (E) Lung injury score of Trdmt1 knockout rats after 1 mg/kg LPS treatment (n = 20). WT, wild‐type rats; KO, Trdmt1 knockout rats. Mean ± SEM; *P < 0.05, **P < 0.01, ***P < 0.001
