Figure 1.
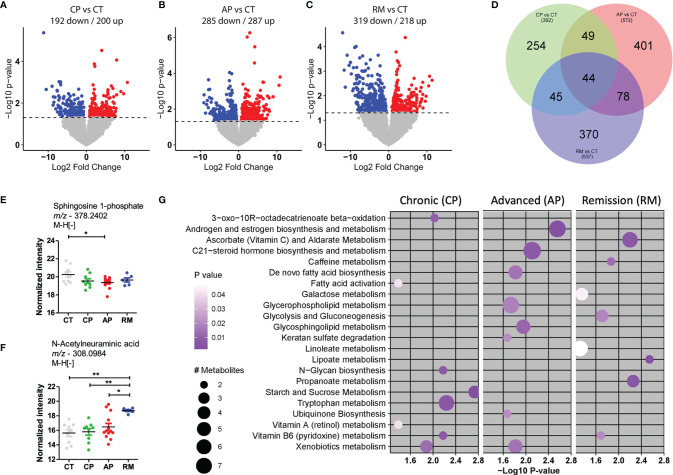
Metabolites differentially abundant in CML patients in comparison with the control group. (A–C) Volcano plots to compare down- and upregulated metabolites in (A). CML patients in the chronic phase (CP; n = 10) and control group (CT; n = 9); (B) CML patients in the advanced phase (AP, n = 13) and control group (CT); (C) CML patients in remission post-TKI therapy (RM; n = 6) and control group (CT). (D) Venn diagram of differentially abundant metabolites in each group, after comparison. (E, F) Scatter-plots of the amount of top predicted metabolites in CML patients and the control group. Sphingosine-1-phosphate was less abundant in CML-AP patients than in the control group. N-Acetylneuraminic acid was more abundant in patients in remission than in control subjects and CML-CP and CML-AP patients. (G) The most representative metabolic pathways in CML patients, compared with the control group. The circle size represents the number of differentially abundant metabolites, and the circle color means the degree of significance (p-value magnitude) after comparison among groups. Significant metabolite features were identified by ANOVA with repeated measures, associated with Tukey’s multiple comparisons test (* p < 0.05; ** p < 0.01).

