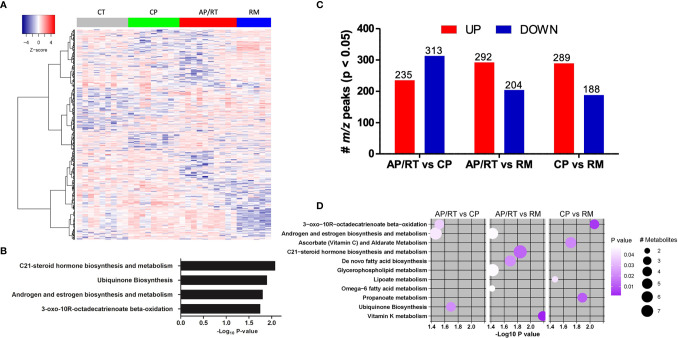
Figure 3.
Dynamic of the abundance of metabolite features associated with disease progression and response to TKI therapy. (A) One-way hierarchical clustering based on the intensity of highly significant metabolite features selected by ANOVA. (B) Metabolic pathways enriched by significant metabolite features. (C) Up- and downregulated abundant metabolites in patients in advanced (AP)/resistant (RT) vs. chronic phase (CP), AP/RT vs. remission post-TKI (RM), and CP vs. RM. (D) Metabolic pathways enriched by significant metabolite features. The circle size represents the number of differentially abundant metabolites, and the circle color means the degree of significance (p-value magnitude) after comparison between the control and CML patient groups.

