Figure 3.
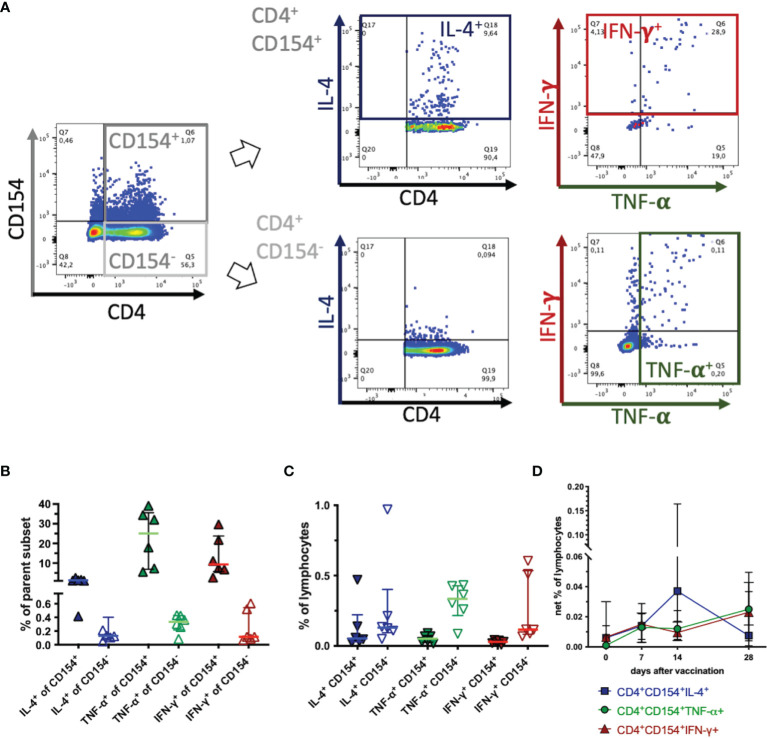
CD154 marks activated, cytokine expressing T helper cells. PBMC were re-stimulated with tetanus toxoid in vitro and analyzed by flow cytometry. Pseudocolor plots with enlarged dots illustrate gating in one example on day 14 after vaccination. (A) In singlet live lymphocytes CD4+CD154+ and CD4+CD154- were gated. These subsets were analyzed for cytokine expression of IL-4 (blue), TNF-α (green), and IFN-γ (red) as the sum of two quadrants each. (B) The percentages of each fraction (CD154+ filled symbols, CD154- open symbols) of the parent population are plotted. (C) The percentage of each fraction are calculated and plotted as percentages of all live lymphocytes (without medium correction). Horizontal bars represent medians and interquartile ranges of n=6. (D) CD4+CD154+cytokine+ were analyzed and are plotted as net % of live lymphocytes (with medium correction) before (0) and on days 7, 14 and 28 after vaccination. Medians and interquartile ranges of n=6 (day 28 n=4) are depicted. Differences after vaccination compared to pre-vaccination were not statistically significant (ns).

