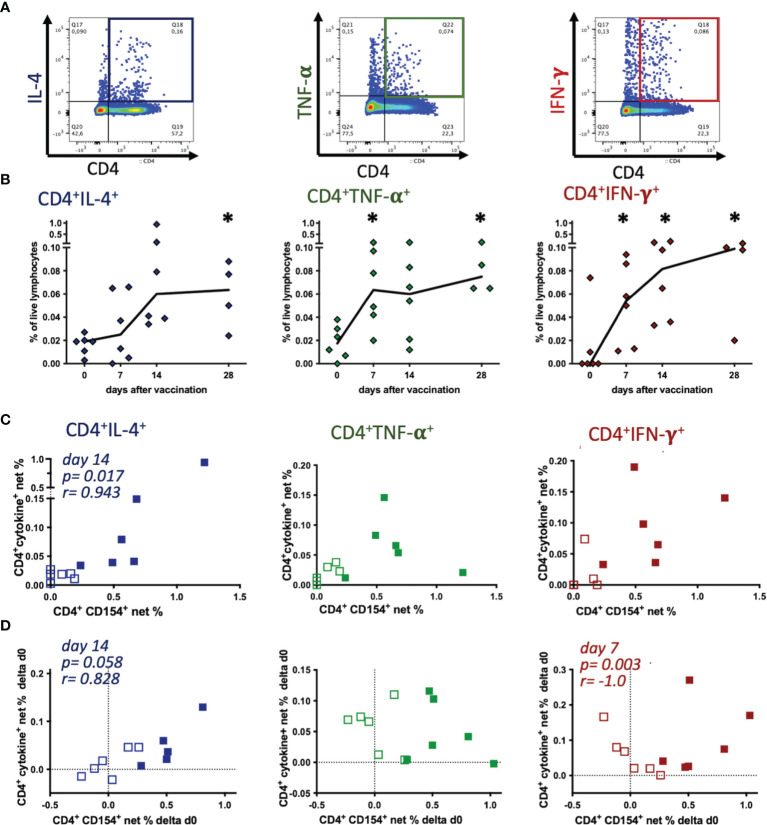
Figure 4.
Tetanus toxoid-reactive Th cells express several cytokines, but CD154 expression mainly correlates with IL-4 induction. PBMC were re-stimulated with tetanus toxoid in vitro compared to medium incubation. (A) Pseudocolor plots with enlarged dots of a representative sample (singlet live lymphocytes) illustrate the gating of each cytokine. (B) Net % of live lymphocytes of CD4+IL-4+, CD4+TNF-α+, and CD4+IFN-γ+ before (0) and on days 7, 14 and 28 after vaccination are plotted. Connecting lines represent medians of n=6 (day 28 n=4). Significant differences after vaccination compared to pre-vaccination frequencies are indicated as * for the respective days (p<0.05). (C, D) Comparisons of net % of TT-reactive CD4+CD154+ vs. CD4+IL-4+, CD4+TNF-α+, or CD4+IFN-γ+ of lymphocytes are plotted. (C) Net % on day 0 (pre-vaccination, open symbols) and day 14 (filled symbols), or (D) the increase (Δd0) calculated as the difference between days 7 (open symbols) or 14 (filled symbols) and pre-vaccination (day 0) are plotted. Dotted lines represent 0 difference, for orientation. Spearman correlations are indicated by p and r.

