Figure 3.
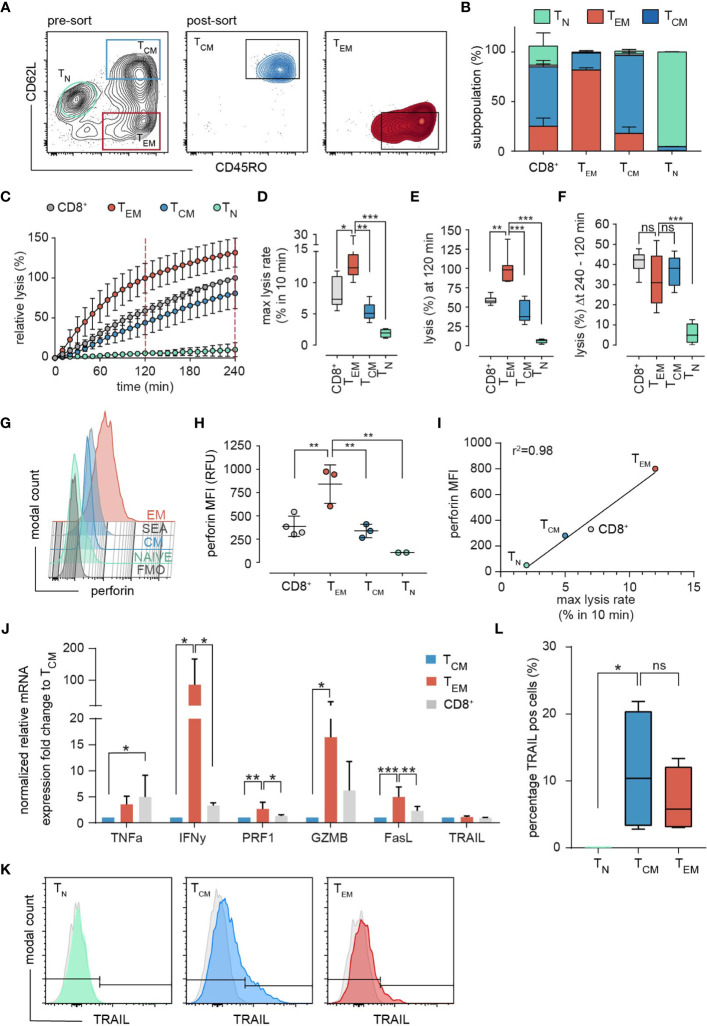
Subset-specific cytotoxicity of sorted TEM and TCM. (A) Representative example of the sorting strategy. After exclusion of doublets and dead cells by light scatter parameters, the SEA-CTL (CD8+) population was separated and sorted into TEM and TCM cells by the surface marker CD62L and CD45RO. 24h after sorting cells were re-analyzed by a staining of CD45RA and CCR7. The subset composition of sorted samples is shown as stacked bar graphs (B), (TEM, red; TCM, blue; TN, green). (C) Cytotoxicity of sorted TEM, TCM, TN and of the unsorted SEA-CTL population (CD8+) was analyzed by a calcein-based real-time killing assay. (D-F) To quantify the killing efficiency, the maximal lysis rate (maximal target cell lysis within a 10 min interval), the target lysis between 0 - 120 min (E) and 120 min - 240 min (F) were analyzed (number of donors, SEA-CTL (CD8+) n=9, TEM n=8, TCM n=7, TN n=4 donors). Box and whisker plots in D-F show min, max, median, and 25-75% interquartile range. Statistical analysis was done by a one-way ANOVA. (G) Perforin expression in sorted TEM, TCM, TN and in the unsorted SEA-CTL (CD8+) population of a representative donor analyzed by flow cytometry. (H) Quantification of intracellular perforin by MFI. SEA-CTL (CD8+) n=4, TEM n=3, TCM n=3, TN n=2 donors. Scatter plots show mean ± SD, statistical analysis was done by a one-way ANOVA. (I) MFI of intracellular perforin (H) plotted against maximal lysis rates (D). (J) Expression of various effector molecules, TNFa, IFNy, PRF1, GZMB, FASL and TRAIL genes was analyzed on mRNA level by RT-qPCR, 48h after sorting. Relative mRNA expression is shown as fold change normalized to the TCM population. TEM and TCM n=4, SEA-CTL (CD8+) n=2 donors. Bar graphs show means ± SD. (K) Expression of TRAIL in TN, TCM and TEM subsets analyzed by flow cytometry. (L) Percentage of TRAIL positive cells was quantified as a box and whisker plot. N = 4 donors. Statistical analysis was done by a Kruskal-Wallis-Test. *p<0.05; **p<0.01; ***p<0.001; ns, no significant difference.

